Fig. 1.
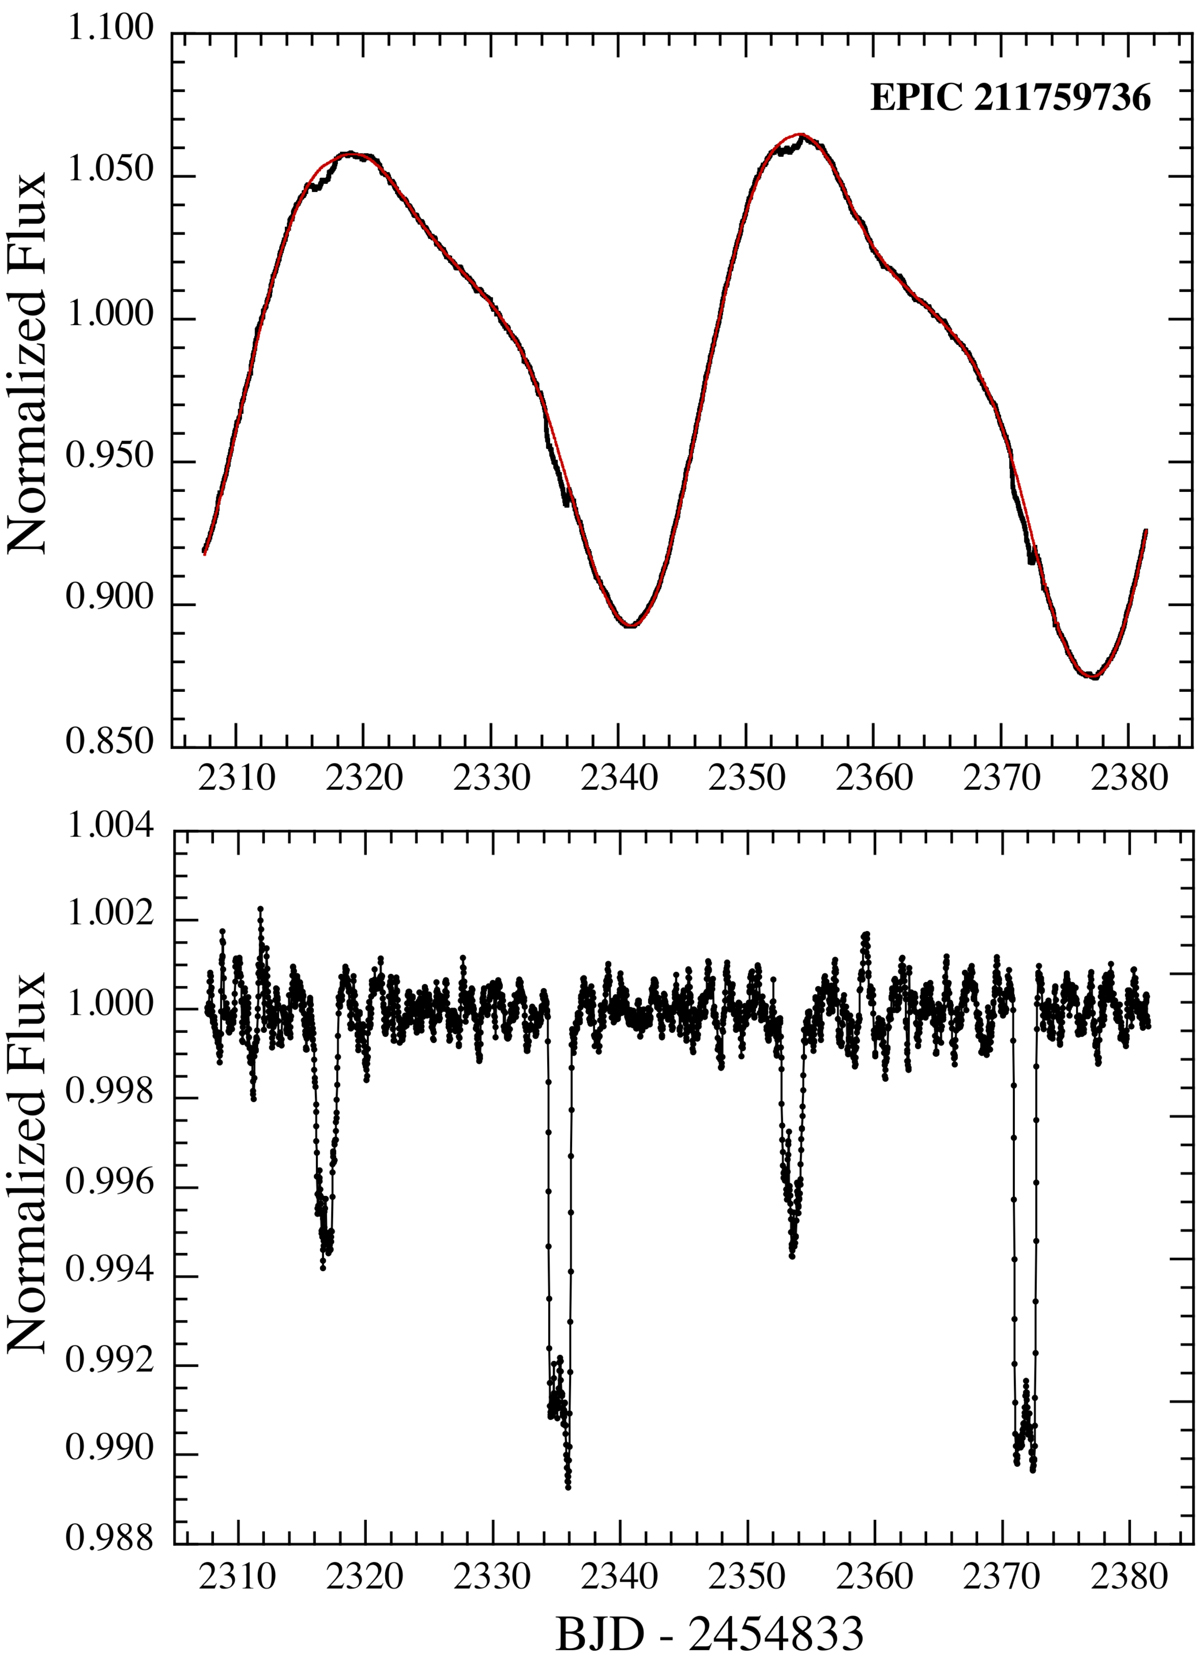
K2 light curve of EPIC 211759736 spanning 75 days. Top panel: black curve is the raw light curve, while the thin red curve is a spline-smoothed version. Bottom panel: difference between the black and red curves in the top panel, showing more clearly both the primary and secondary eclipses. We highlight the difference in vertical scale by a factor of ∼15. The eclipse depths are at most 5% of the full amplitude (≈0.2 mag) of the light variations.
Current usage metrics show cumulative count of Article Views (full-text article views including HTML views, PDF and ePub downloads, according to the available data) and Abstracts Views on Vision4Press platform.
Data correspond to usage on the plateform after 2015. The current usage metrics is available 48-96 hours after online publication and is updated daily on week days.
Initial download of the metrics may take a while.