Fig. 9.
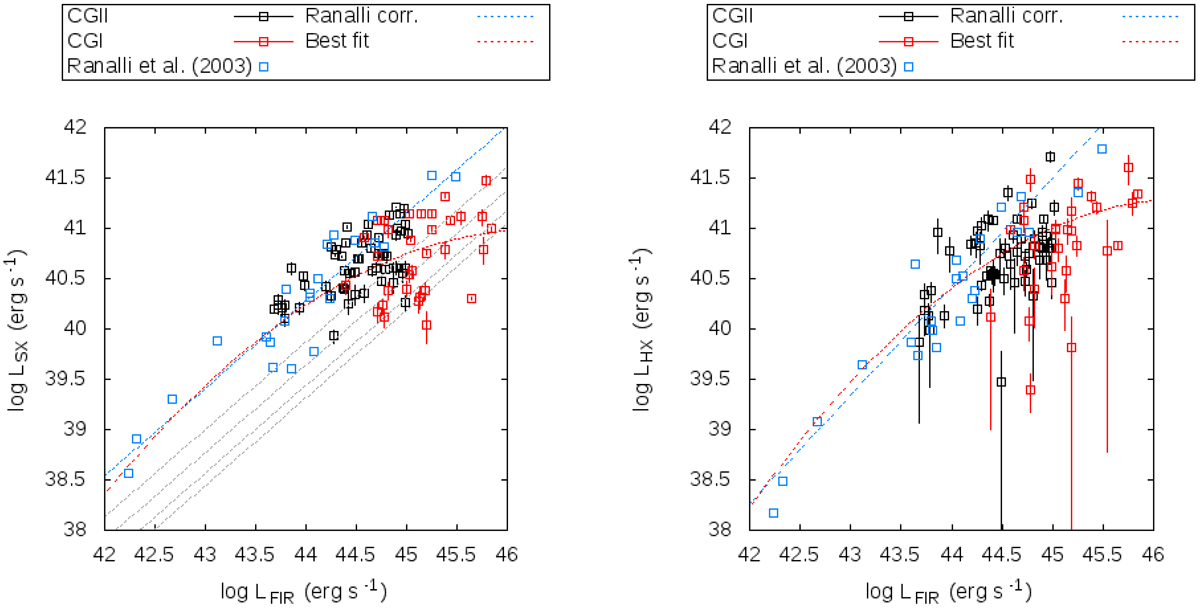
Plots of soft (left panel, 0.5−2 keV) and hard (right panel, 2−10 keV) X-ray luminosity versus FIR luminosity derived as in Eq. (1), where the X-ray luminosity is corrected only for Galactic absorption. Data used by Ranalli et al. (2003), along with their derived correlation, are shown in blue. CGI and CGII data (for galaxies without an AGN) are plotted in red and black squares respectively. When multiple objects are present in a source, their IR luminosity is divided as shown in Table 3. All sources containing AGN, as listed in Table 5 or classified as AGN by Iwasawa et al. (2011) have been removed both from the plot and from the fits. The red, dashed line shows our best quadratic fit for the C-GOALS + Ranalli et al. (2003) data. Grey, dashed lines (left panel) show theoretical lines of obscuration for NH = 0.5, 1.0, 2.0, 5.0 × 1022 cm22, as described in Sect. 4.5.
Current usage metrics show cumulative count of Article Views (full-text article views including HTML views, PDF and ePub downloads, according to the available data) and Abstracts Views on Vision4Press platform.
Data correspond to usage on the plateform after 2015. The current usage metrics is available 48-96 hours after online publication and is updated daily on week days.
Initial download of the metrics may take a while.