Fig. 5.
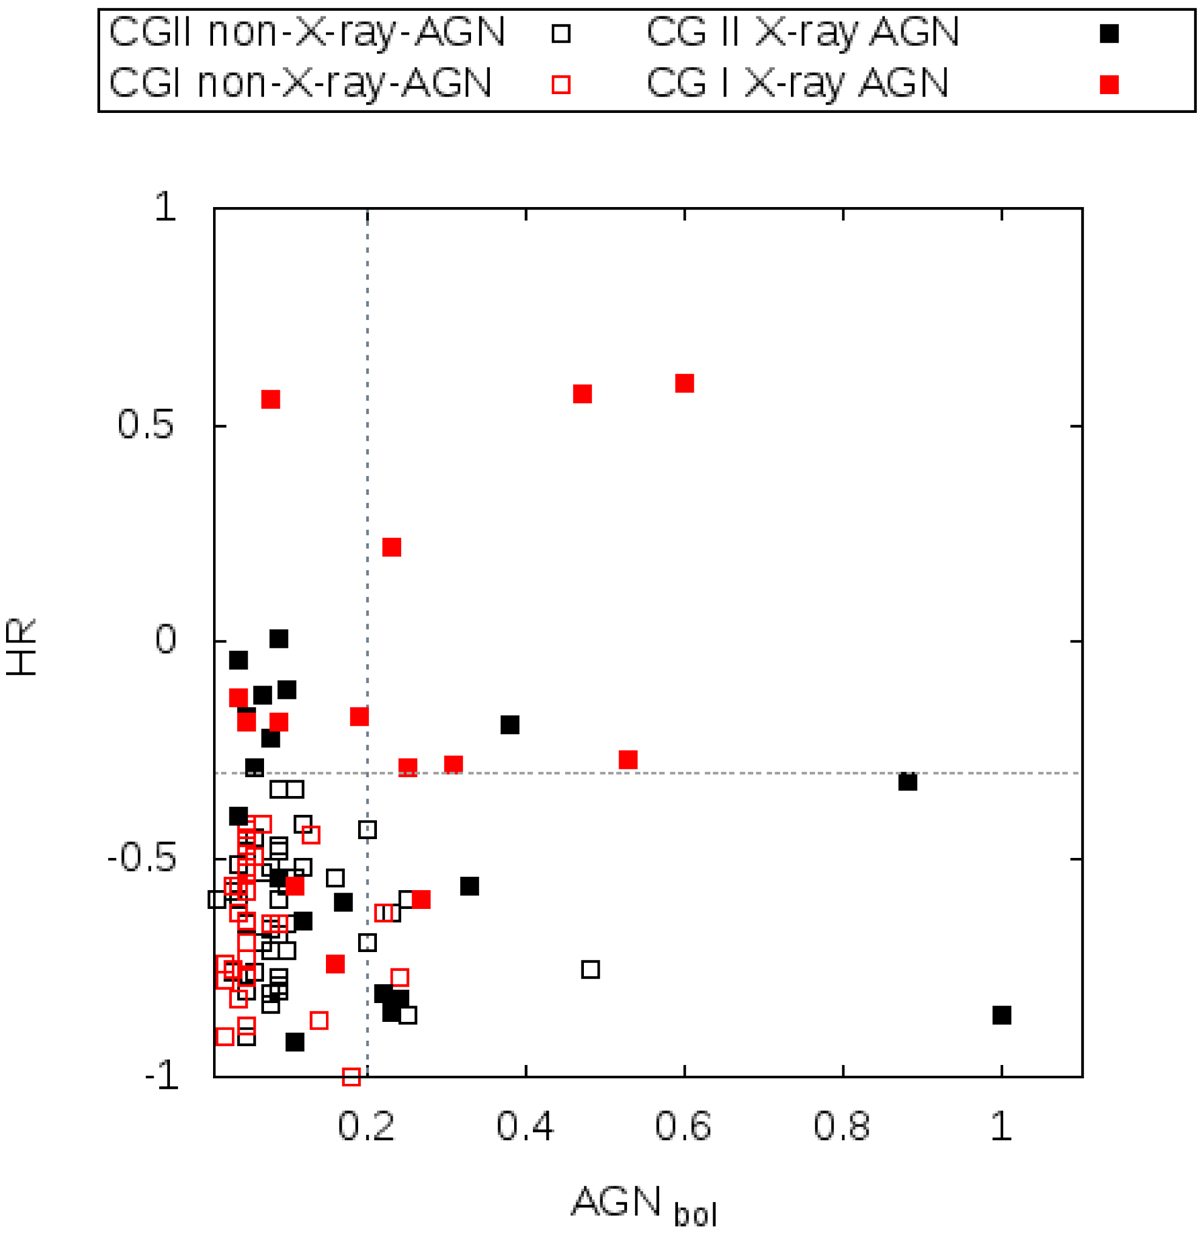
Hardness ratio as a function of the fractional contribution of the AGN to the bolometric luminosity (as derived from MIR data, Díaz-Santos et al. 2017) of the source, in red for CGI sources and black for CGII. X-ray selected AGN from Table 5 are plotted as filled squares.The horizontal dashed line shows the HR = −0.3 threshold. The vertical dashed line shows the value above which the AGN is energetically significant.
Current usage metrics show cumulative count of Article Views (full-text article views including HTML views, PDF and ePub downloads, according to the available data) and Abstracts Views on Vision4Press platform.
Data correspond to usage on the plateform after 2015. The current usage metrics is available 48-96 hours after online publication and is updated daily on week days.
Initial download of the metrics may take a while.