Fig. 4.
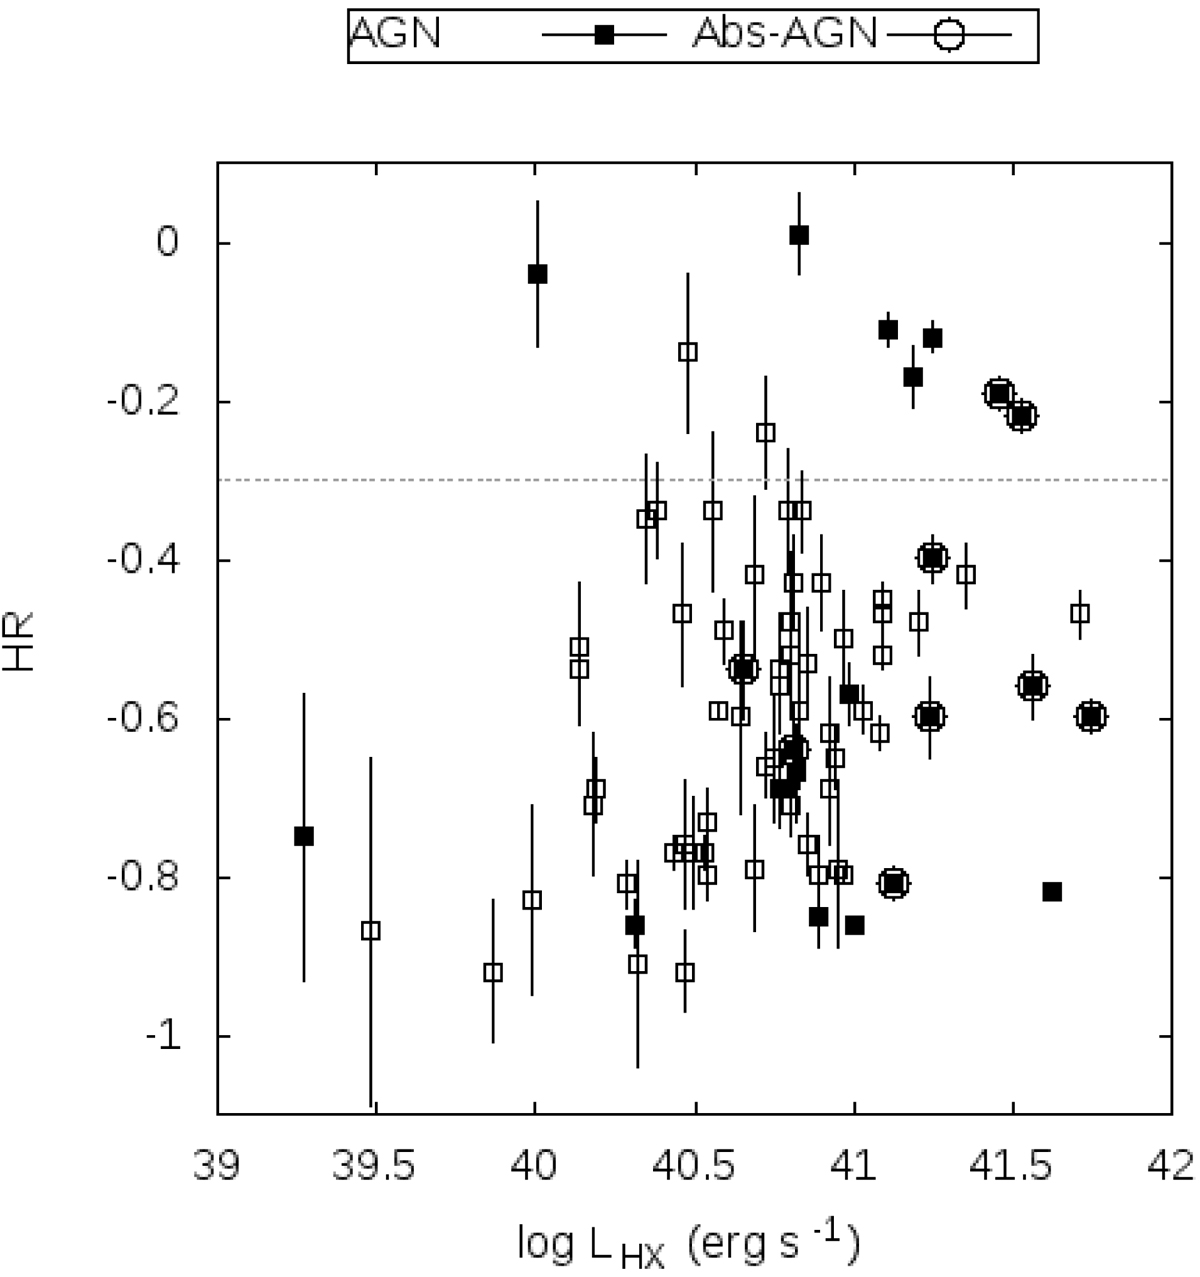
Hardness ratio as a function of the 2−7 keV luminosity for all sources in the CGII sample. All AGN from Table 5 are plotted as filled squares, and those in which absorption features are fit (labeled A in the table) are marked with an open circle. The dashed line shows the −0.3 boundary, above which sources are selected as AGN (unless evidence points toward a lack of AGN presence, see Appendix A).
Current usage metrics show cumulative count of Article Views (full-text article views including HTML views, PDF and ePub downloads, according to the available data) and Abstracts Views on Vision4Press platform.
Data correspond to usage on the plateform after 2015. The current usage metrics is available 48-96 hours after online publication and is updated daily on week days.
Initial download of the metrics may take a while.