Fig. 2.
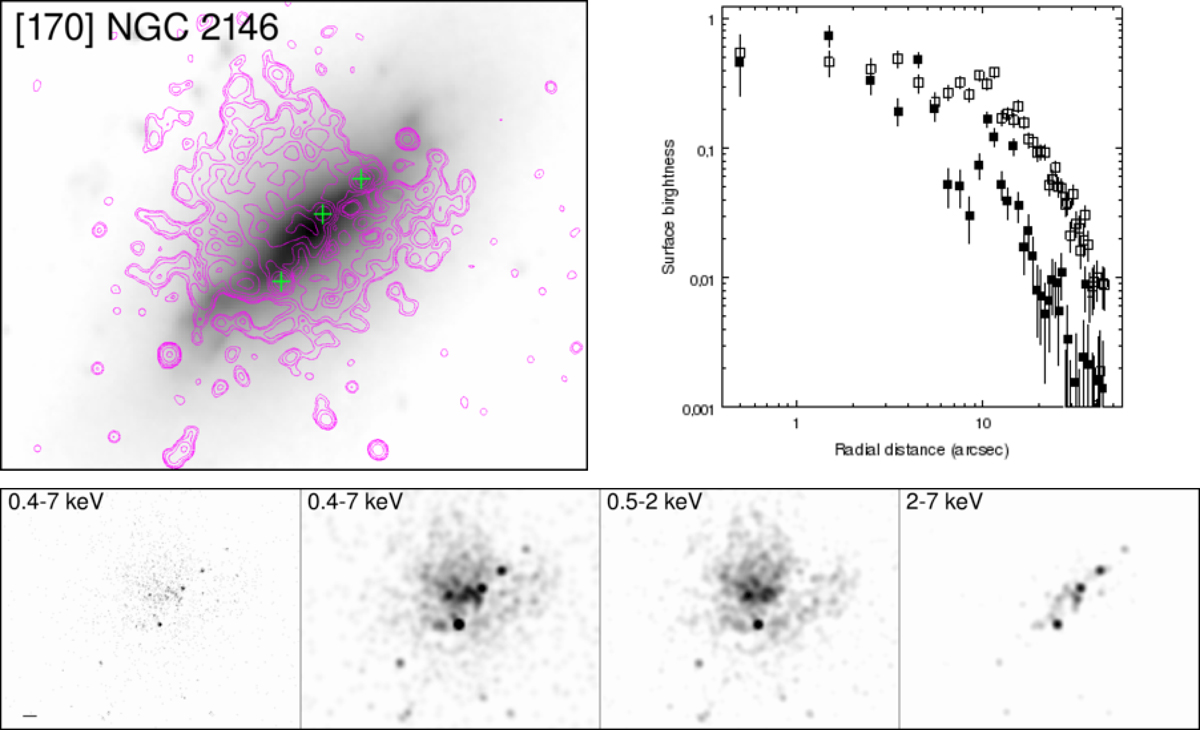
X-ray images and surface brightness profiles for NGC 2146. North is up and east to the left. Similar figures for all 59 objects in the CGII sample are presented in Appendix B. Upper left: X-ray (0.4−7 keV) brightness contours (magenta) with marked hard X-ray peaks (green crosses) overlaid on optical/IR images. Upper right: Radial surface brightness profiles in the 0.5−2 keV band (open squares) and the 2−7 keV band (filled squares). Profiles have been centered using the brightness peak in the hard X-ray band, when clearly originating in the nucleus. We refer to Appendix A for ambiguous objects. Bottom: From left to right, unsmoothed and smoothed images in the 0.4−7 keV band, and smoothed images in the soft (0.5−2 keV) and hard (2−7 keV) bands. The pixel size is ∼0.5″ × 0.5″. The scale bar in the bottom left image represents 5″.
Current usage metrics show cumulative count of Article Views (full-text article views including HTML views, PDF and ePub downloads, according to the available data) and Abstracts Views on Vision4Press platform.
Data correspond to usage on the plateform after 2015. The current usage metrics is available 48-96 hours after online publication and is updated daily on week days.
Initial download of the metrics may take a while.