Fig. 13.
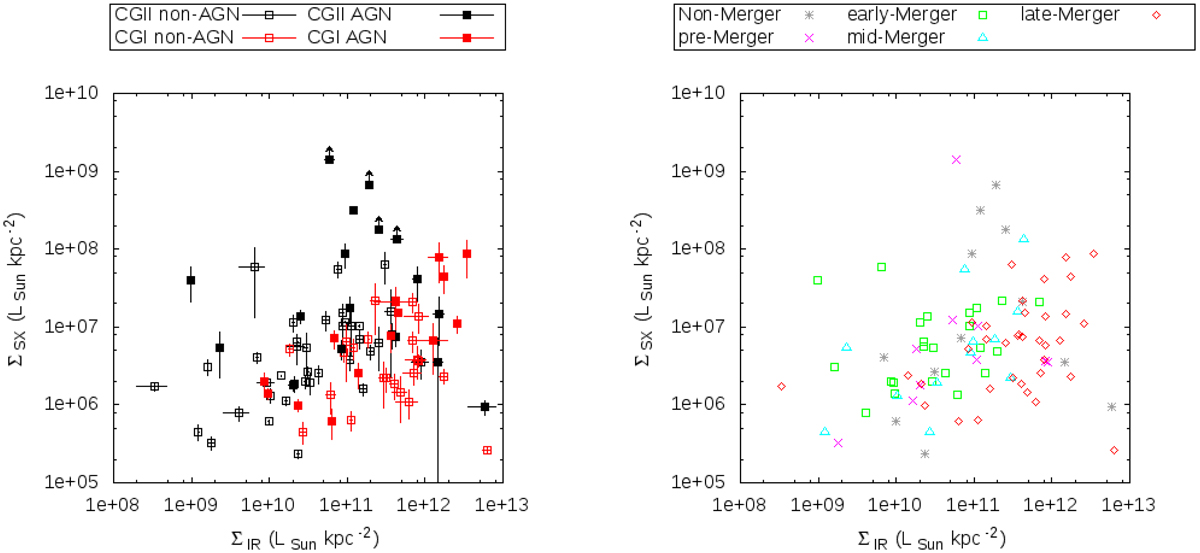
Plots of X-ray luminosity surface density vs. IR luminosity surface density. Left panel: red data correspond to CGI sources, and black data corresponds to CGII sources. AGN are highlighted as filled symbols. Right panel: sources in the full C-GOALS sample are plotted as different symbols according to merger stage, as derived by Stierwalt et al. (2013). 11 systems within the whole C-GOALS sample are resolved into individual galaxies in X-rays but not at 70 μm, and are thus not plotted.
Current usage metrics show cumulative count of Article Views (full-text article views including HTML views, PDF and ePub downloads, according to the available data) and Abstracts Views on Vision4Press platform.
Data correspond to usage on the plateform after 2015. The current usage metrics is available 48-96 hours after online publication and is updated daily on week days.
Initial download of the metrics may take a while.