Fig. 12.
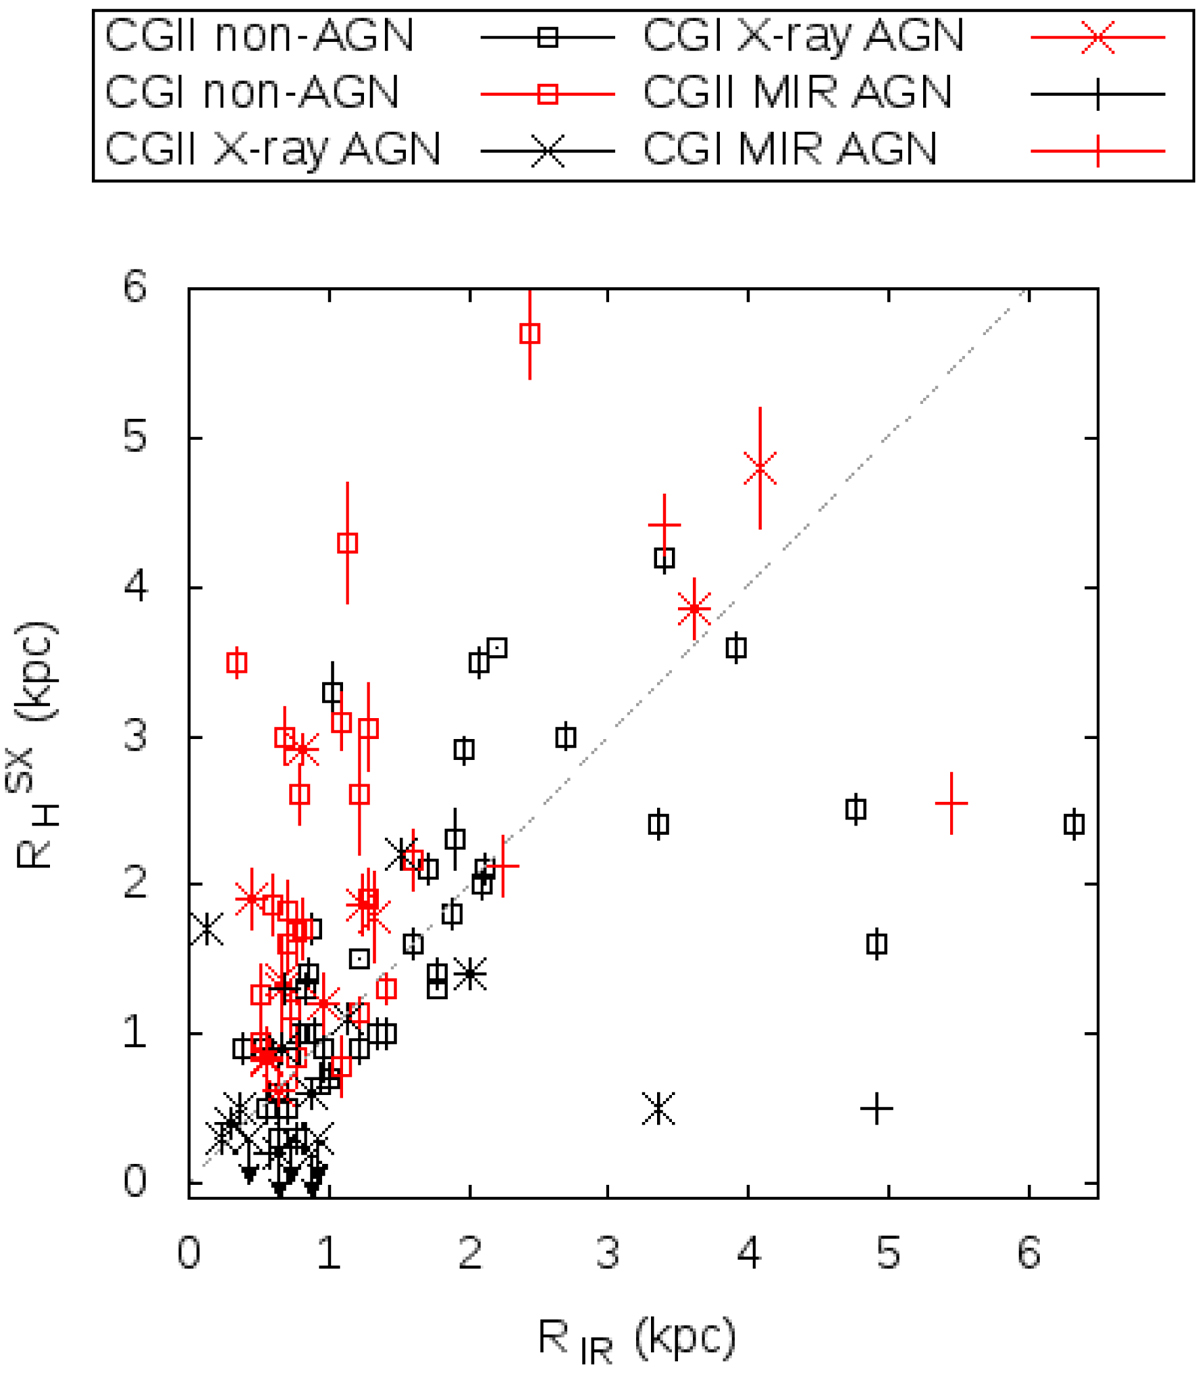
Soft X-ray half-light radius as a function of 70 μm FIR radius, taken from Díaz-Santos et al. (2017). CGI data are shown in red, and CGII data in black. X-ray selected AGN and MIR selected AGN (as specified in Table 5) are plotted separately. The dashed line shows ![]() , and is not a fit to the data. Eleven systems within the whole C-GOALS sample are resolved into individual galaxies in X-rays but not at 70 μm, and are thus not plotted.
, and is not a fit to the data. Eleven systems within the whole C-GOALS sample are resolved into individual galaxies in X-rays but not at 70 μm, and are thus not plotted.
Current usage metrics show cumulative count of Article Views (full-text article views including HTML views, PDF and ePub downloads, according to the available data) and Abstracts Views on Vision4Press platform.
Data correspond to usage on the plateform after 2015. The current usage metrics is available 48-96 hours after online publication and is updated daily on week days.
Initial download of the metrics may take a while.