Fig. 1.
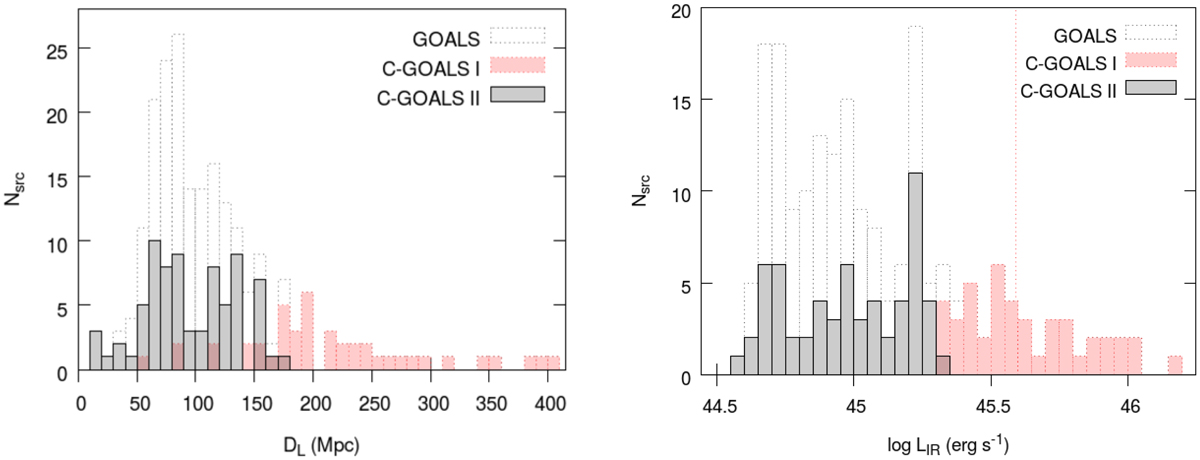
Distribution of luminosity distance (left panel) and IR luminosity LIR(8−1000 μm) (right panel) for the 44 objects of C-GOALS I (Iwasawa et al. 2011), the 63 objects of C-GOALS II, and the 201 systems of the full GOALS sample (Armus et al. 2009). The vertical dashed line represents LIR = 1012 L⊙, the boundary between LIRGs and ULIRGs.
Current usage metrics show cumulative count of Article Views (full-text article views including HTML views, PDF and ePub downloads, according to the available data) and Abstracts Views on Vision4Press platform.
Data correspond to usage on the plateform after 2015. The current usage metrics is available 48-96 hours after online publication and is updated daily on week days.
Initial download of the metrics may take a while.