Fig. 8.
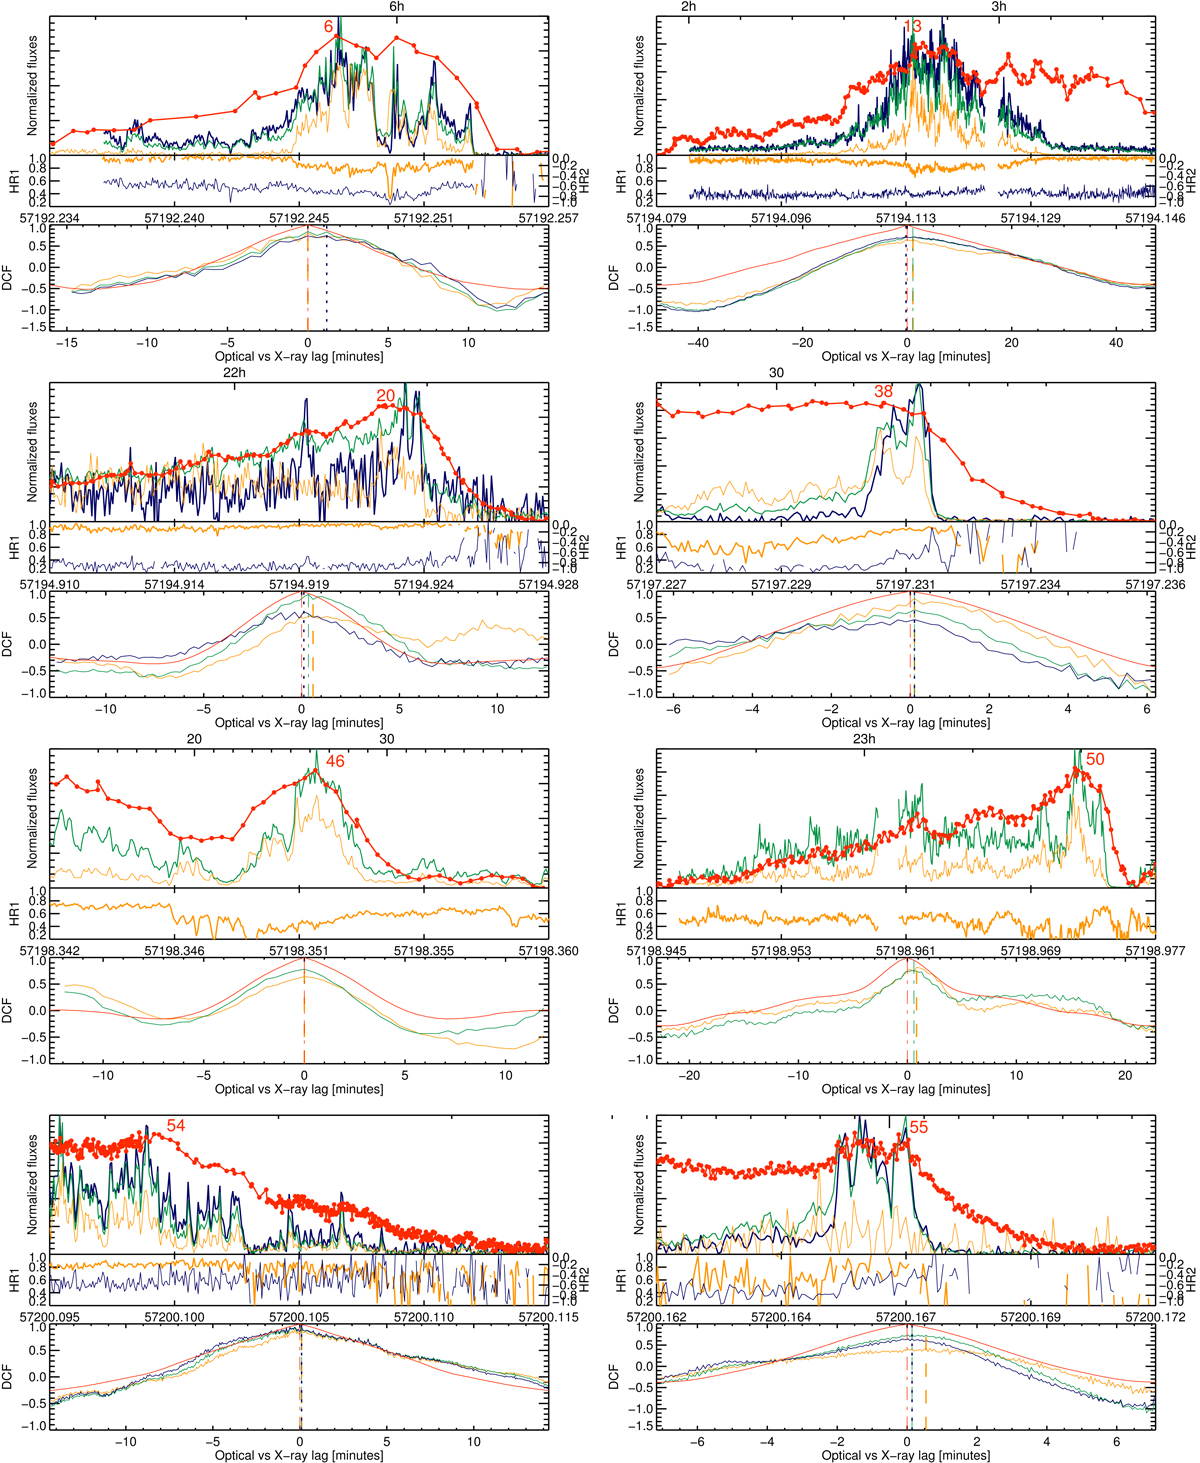
Zoomed-in optical and X-ray light curves where optical flares are essentially simultaneous with X-ray flares (optical is shown in red, soft X-ray (3–10 keV) in orange, hard X-ray (20–80 keV for ISGRI, or 10–79 keV for NuSTAR) in green, and very hard X-ray (80–200 keV) in dark blue). For each subplot, the HRs (HR1 is plotted in orange, and HR2 in dark blue) and the DCFs (optical ACF is shown in red, optical/soft X-ray DCF in orange, optical/hard X-ray DCF in green, and optical/very hard X-ray in dark blue) are shown below the light curves. The variation in behaviour is discussed in the text.
Current usage metrics show cumulative count of Article Views (full-text article views including HTML views, PDF and ePub downloads, according to the available data) and Abstracts Views on Vision4Press platform.
Data correspond to usage on the plateform after 2015. The current usage metrics is available 48-96 hours after online publication and is updated daily on week days.
Initial download of the metrics may take a while.