Free Access
Fig. 6.
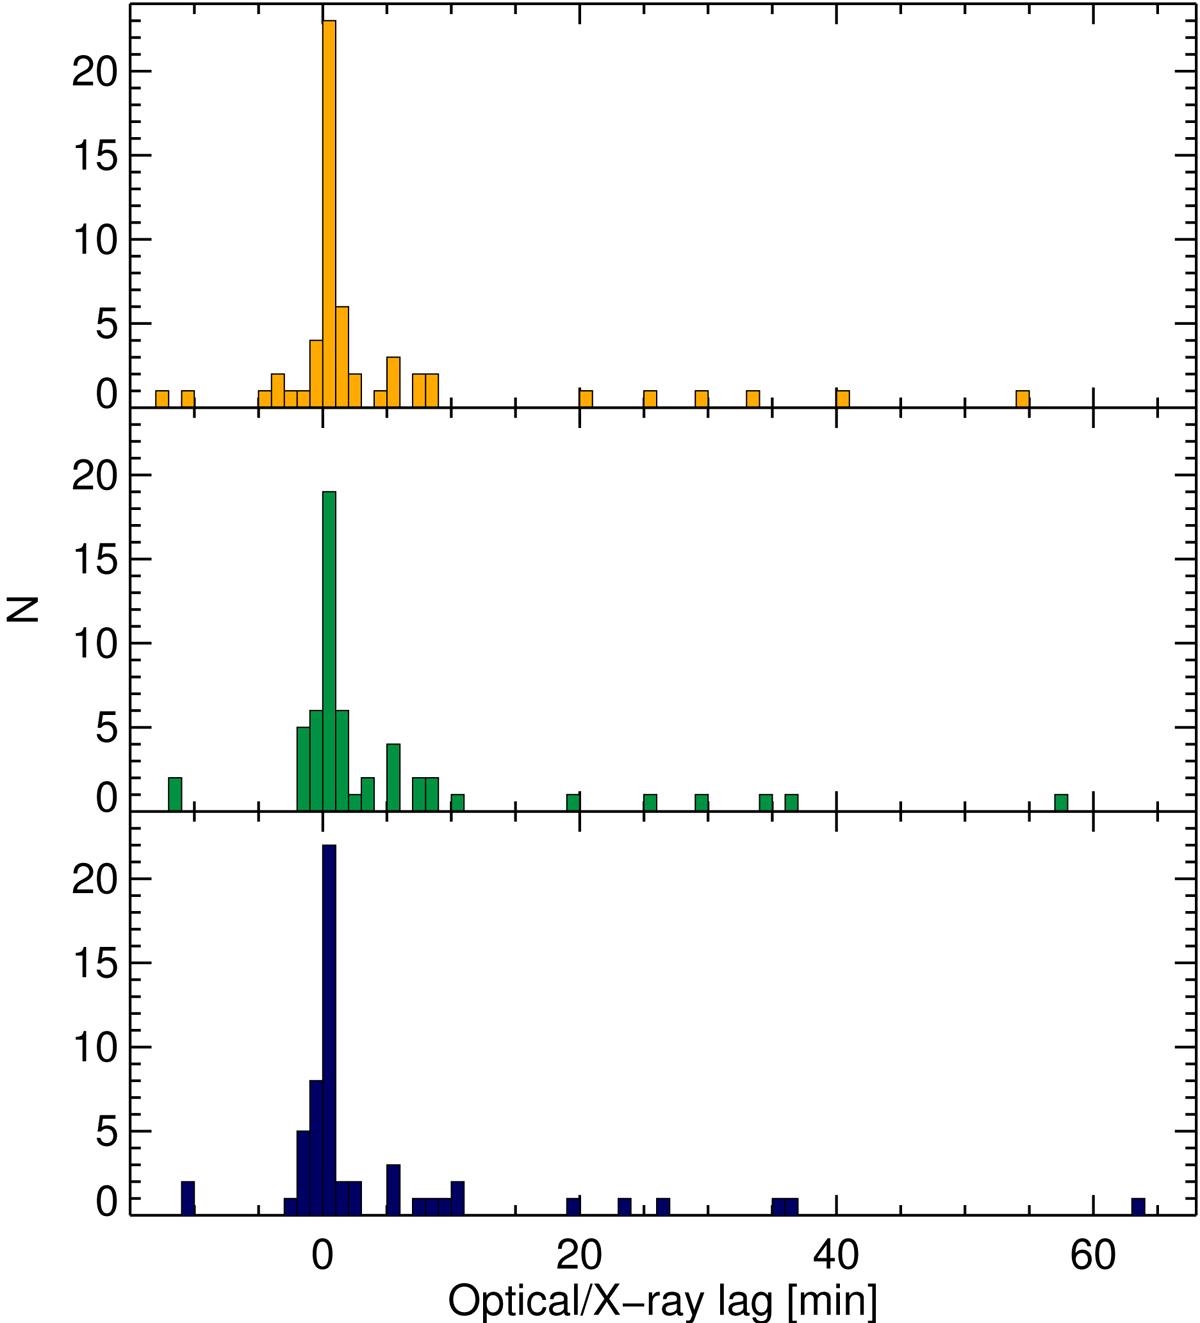
Histogram of the measured lags between the optical and soft X-rays (3–10 keV; top), optical and hard X-rays (20–80 keV for INTEGRAL data, 10–79 keV for NuSTAR data; middle), and optical and very hard X-rays (80–200 keV; bottom). The bin size is 1 min.
Current usage metrics show cumulative count of Article Views (full-text article views including HTML views, PDF and ePub downloads, according to the available data) and Abstracts Views on Vision4Press platform.
Data correspond to usage on the plateform after 2015. The current usage metrics is available 48-96 hours after online publication and is updated daily on week days.
Initial download of the metrics may take a while.