Fig. 1.
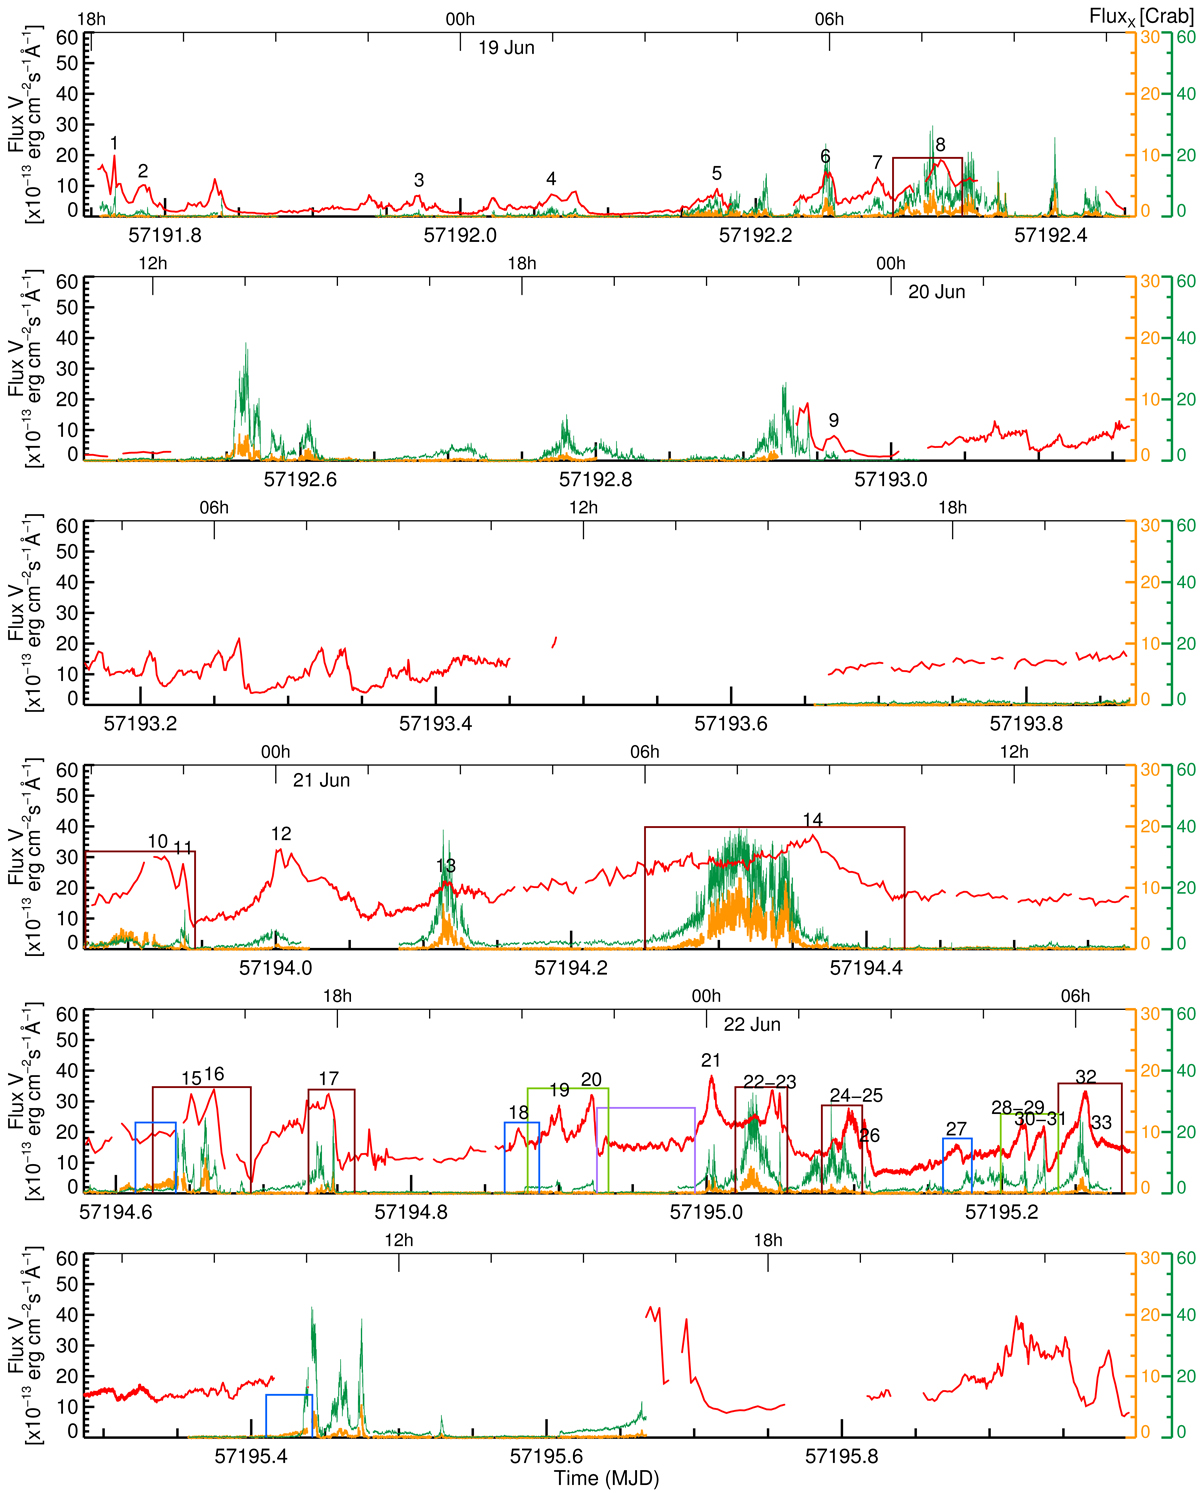
Optical and X-ray light curves of V404 Cyg during the June 2015 outburst from MJD 57191.75 to MJD 57196.00. The optical observations are plotted in red, the soft X-ray emission in the 3–10 keV band is plotted in orange, and the hard X-ray emission in the 20–80 keV band for INTEGRAL/IBIS and in the 10–79 keV band for the NuSTAR observations are plotted both in green. The numbers in black refer to the optical flare identifications. Brown and blue boxes mark flares with positive and negative lags, respectively. Light green boxes represent double symmetric optical flares with simultaneous X-ray emission. Purple boxes represent epochs where heartbeat-type oscillations are observed (see text).
Current usage metrics show cumulative count of Article Views (full-text article views including HTML views, PDF and ePub downloads, according to the available data) and Abstracts Views on Vision4Press platform.
Data correspond to usage on the plateform after 2015. The current usage metrics is available 48-96 hours after online publication and is updated daily on week days.
Initial download of the metrics may take a while.