Fig. 8
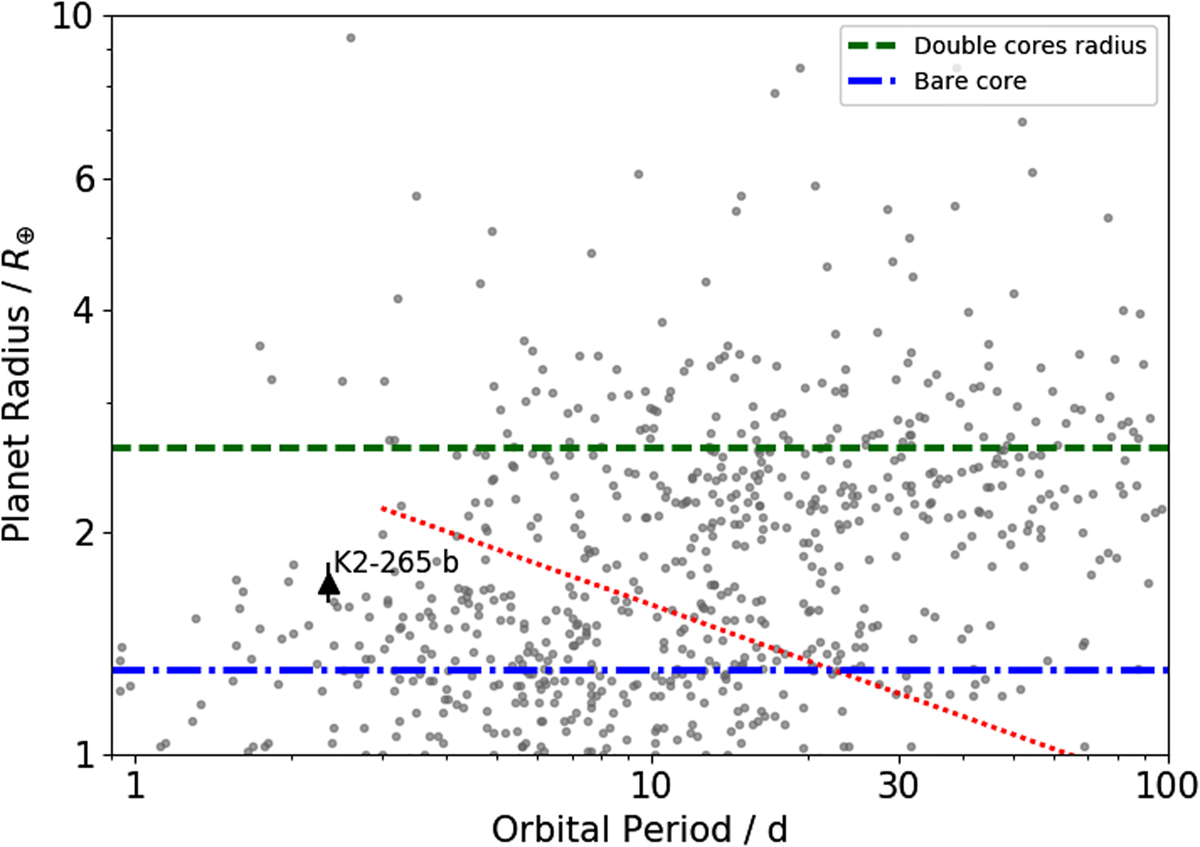
Planet radius distribution as a function of orbital period. The grey circles denote the planet sample obtained from the CKS sample (Fulton et al. 2017). The blue dot-dashed line and the green dashed line indicate the peak of the bimodal distribution of the planet radius distribution, where planets tend to favour radii of ~ 1.3 R⊕ and ~ 2.4 R⊕ due to the photoevaporation mechanism. The red dotted line indicates the lower limit of the photoevaporation valley derived from Owen & Wu (2017).
Current usage metrics show cumulative count of Article Views (full-text article views including HTML views, PDF and ePub downloads, according to the available data) and Abstracts Views on Vision4Press platform.
Data correspond to usage on the plateform after 2015. The current usage metrics is available 48-96 hours after online publication and is updated daily on week days.
Initial download of the metrics may take a while.