Fig. 7
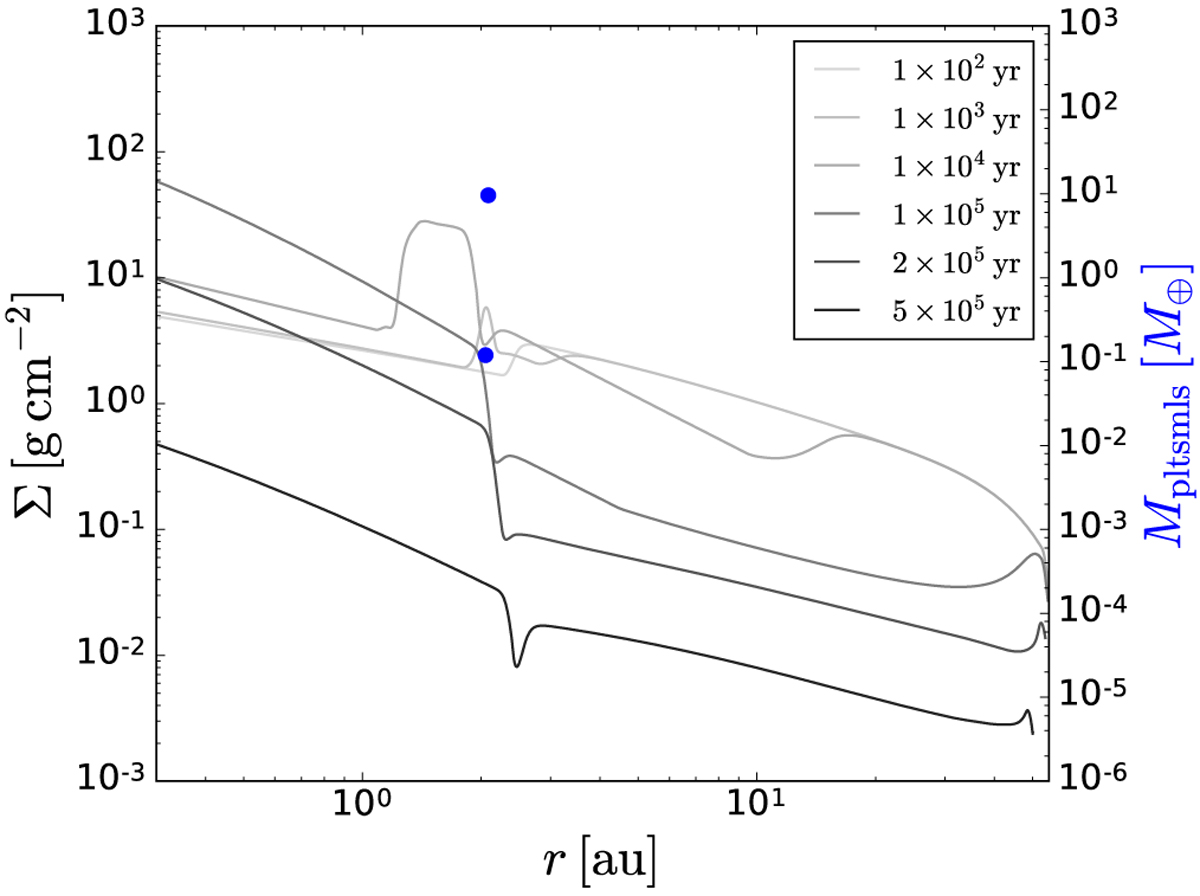
Solids surface density profiles Σ at different points in time for the fiducial model (1a). The blue dots correspond to the mass of planetesimal super-particles Ṁpltsmls in Earth masses at the last time point plotted (t = 5 × 10⁵ yr) (this is also the final total mass in planetesimals, because the planetesimal formation phase ends at ~ 3.2 × 10⁴ yr).
Current usage metrics show cumulative count of Article Views (full-text article views including HTML views, PDF and ePub downloads, according to the available data) and Abstracts Views on Vision4Press platform.
Data correspond to usage on the plateform after 2015. The current usage metrics is available 48-96 hours after online publication and is updated daily on week days.
Initial download of the metrics may take a while.