Fig. A.2
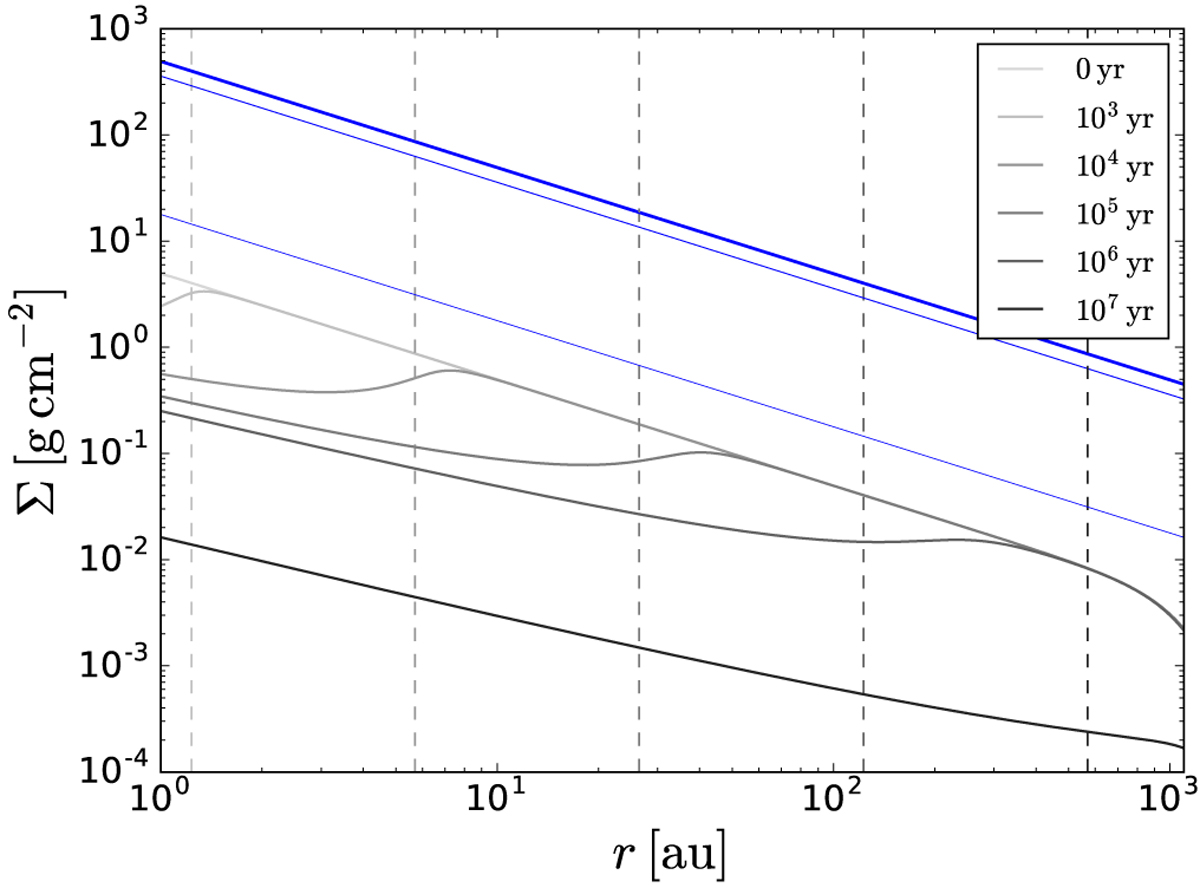
Reproduction of Fig. 1 of Lambrechts & Johansen (2014) with our model. Gray lines correspond to solids surface densities at different points in time (labels denote time in years). Gas surface density profiles are plotted in blue for the same time points. The vertical dashed lines indicate the radial extent of the pebble front defined in Eq. (1) of Lambrechts & Johansen (2014).
Current usage metrics show cumulative count of Article Views (full-text article views including HTML views, PDF and ePub downloads, according to the available data) and Abstracts Views on Vision4Press platform.
Data correspond to usage on the plateform after 2015. The current usage metrics is available 48-96 hours after online publication and is updated daily on week days.
Initial download of the metrics may take a while.