Fig. 6.
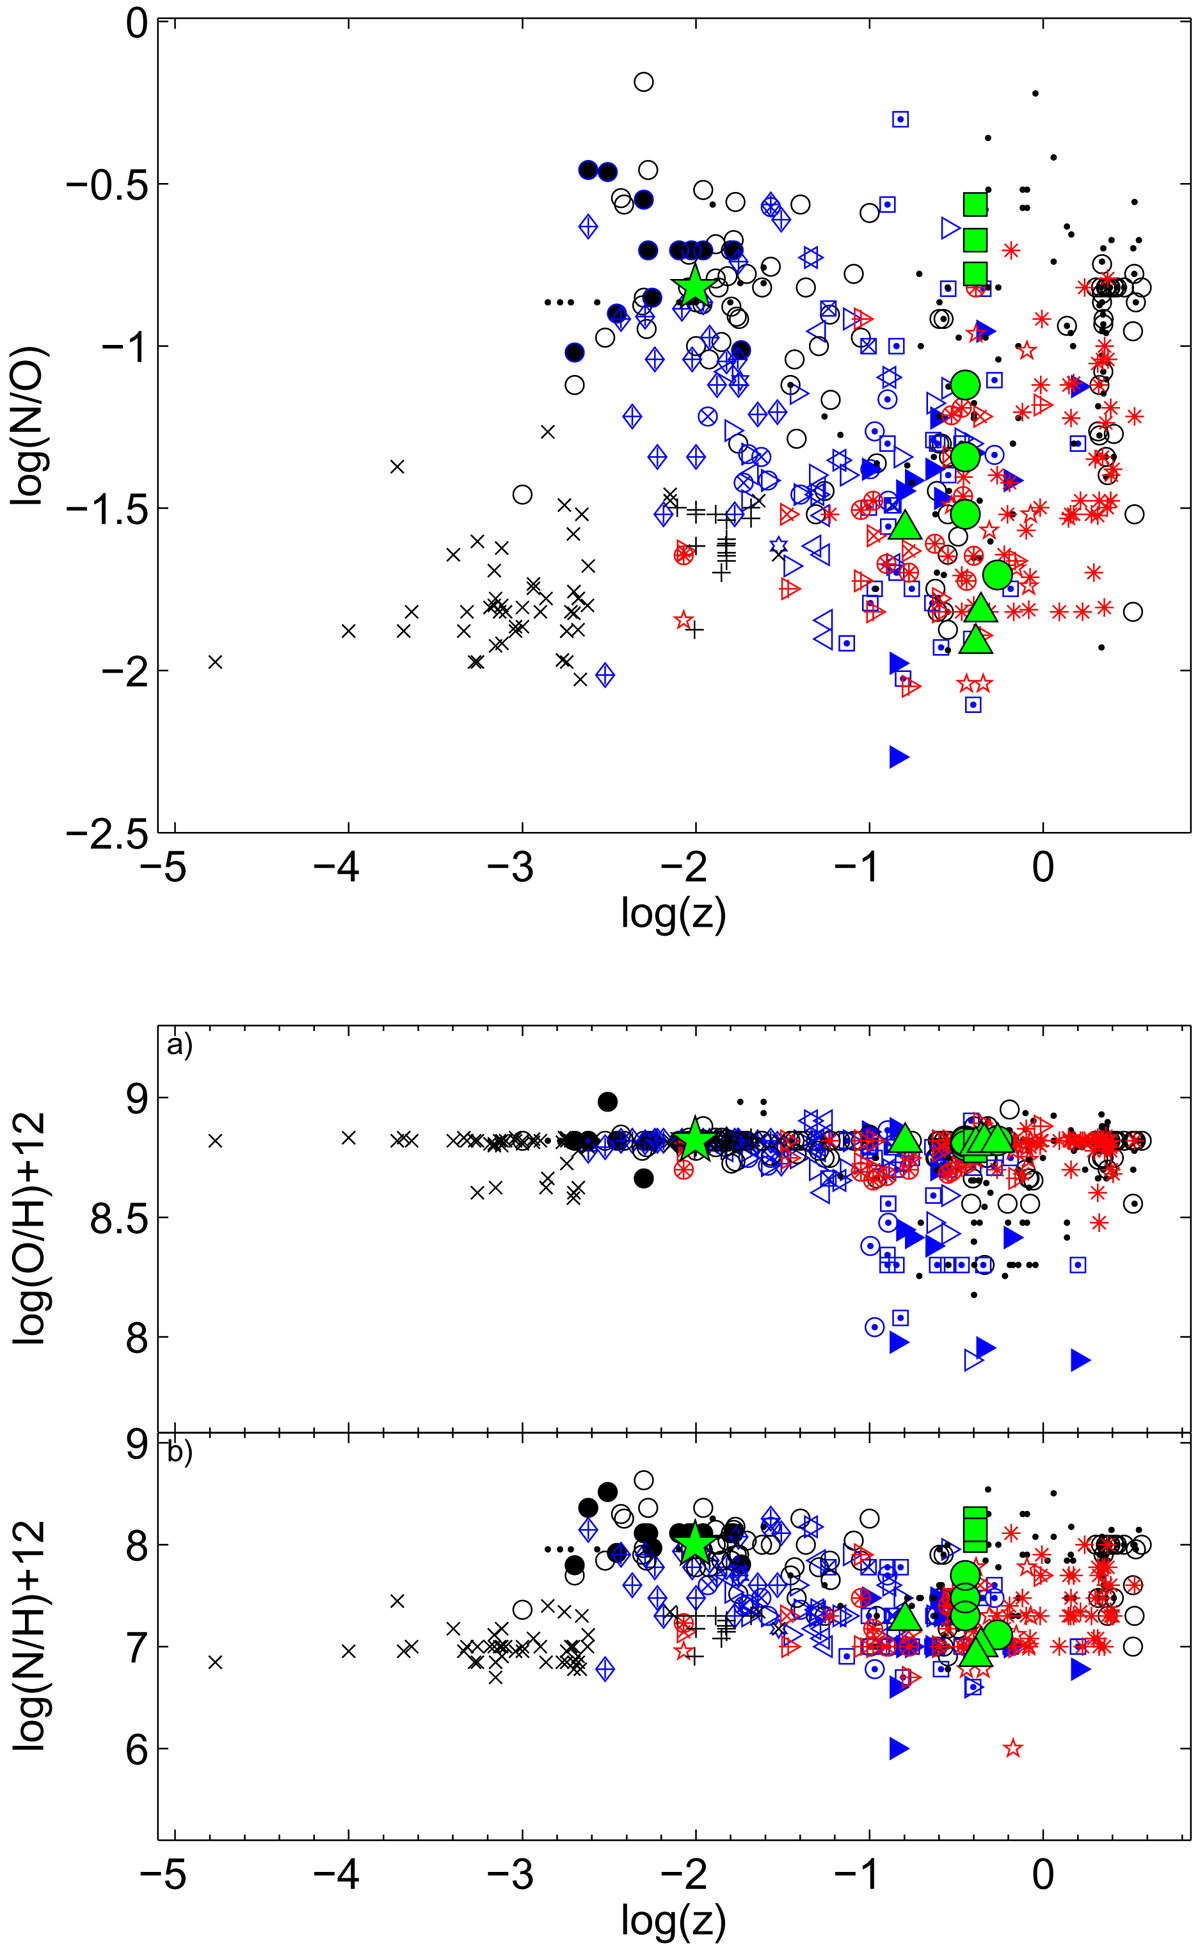
Top: distribution of N/O calculated by detailed modelling for SGRB hosts as function of the redshift. Large green circles: from the spectra observed by de Ugarte Postigo et al. (2014). Large green squares: from Perley et al. (2012). Large green triangles: from Berger. Large green star: NGC 4993. The results obtained in the present paper are superimposed on those calculated for SN host galaxies, long GRB hosts, short GRB hosts, SB, AGN, and LINERs (both local and at higher z), low-luminosity nearby galaxies, and HII regions in local galaxies. Symbols are explained in Table 8. Bottom: the same for O/H and N/H relative abundances. Symbols as in the top diagram.
Current usage metrics show cumulative count of Article Views (full-text article views including HTML views, PDF and ePub downloads, according to the available data) and Abstracts Views on Vision4Press platform.
Data correspond to usage on the plateform after 2015. The current usage metrics is available 48-96 hours after online publication and is updated daily on week days.
Initial download of the metrics may take a while.