Fig. 7.
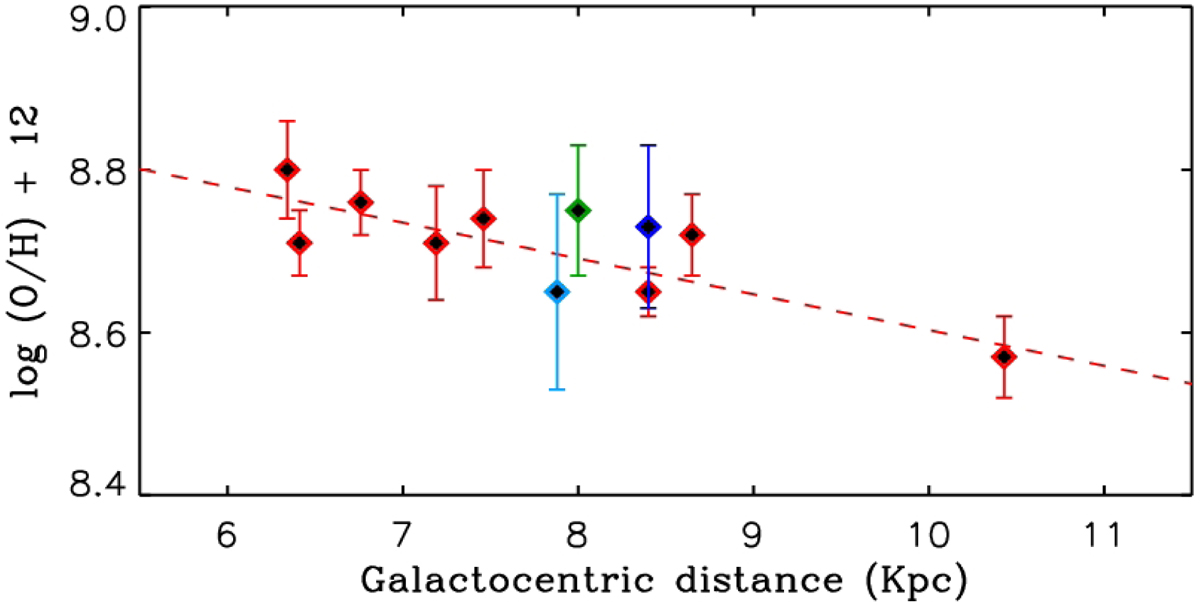
Spatial distribution of the oxygen abundance as a function of Galactocentric distances for Galactic H II regions (red dots), the mean value obtained for Orion OB1 (dark blue dot), the mean value obtained for the solar vicinity (green dot) and the mean value obtained for Cygnus OB2 (light blue dot). The red dashed line represents the least-squares linear fits to the H II regions. The Sun is assumed at 8 kpc.
Current usage metrics show cumulative count of Article Views (full-text article views including HTML views, PDF and ePub downloads, according to the available data) and Abstracts Views on Vision4Press platform.
Data correspond to usage on the plateform after 2015. The current usage metrics is available 48-96 hours after online publication and is updated daily on week days.
Initial download of the metrics may take a while.