Fig. 8
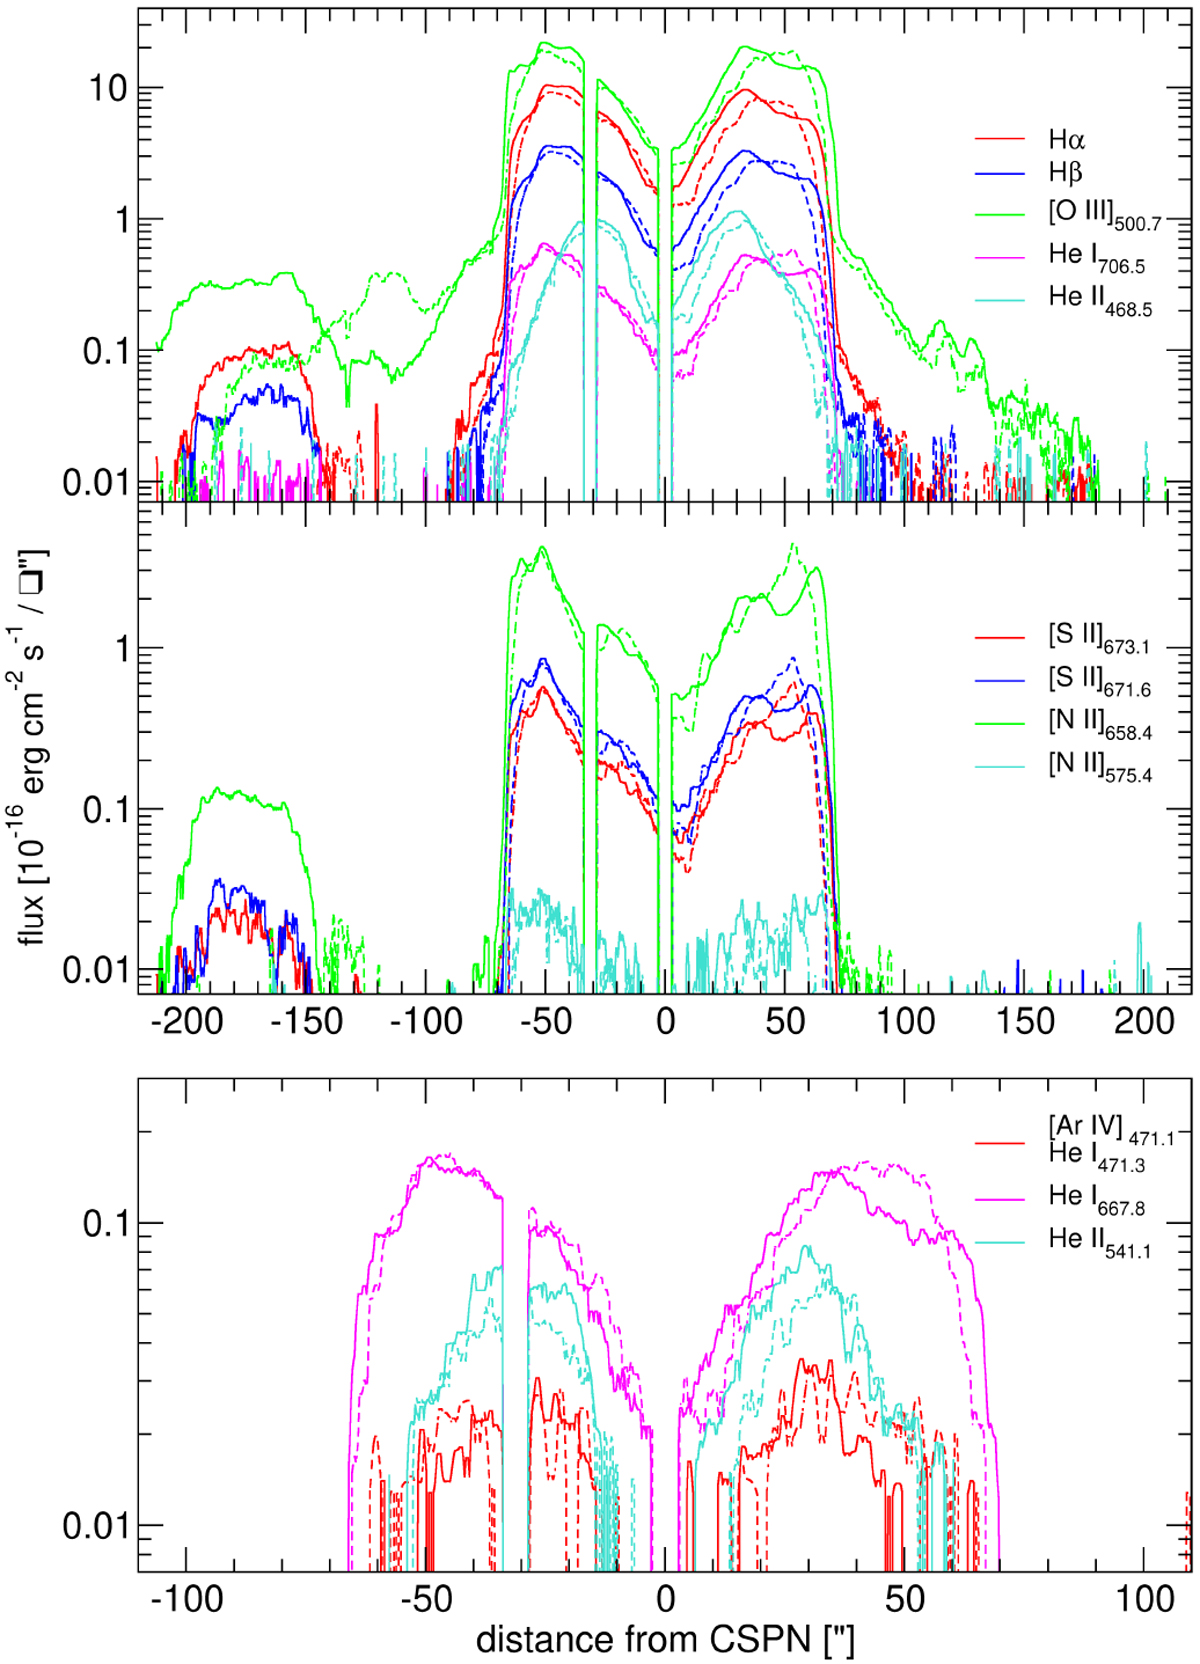
Spatial distribution of the major spectral lines. Upper panel: brightest lines of oxygen, hydrogen and helium. Middle panel: the low ionized states of nitrogen and sulfur. The [N II] 654.8 nm line was skipped for clarityas it caries the same information as the [N II] 658.4 nm line. Lower panel: fainter lines of the two different ionization stages of helium. As the line around 471 nm shows the shape of the higher ionized He ii lines, we have to assume that it is dominated by the [Ar IV] 471.1 nm emission and fewer contribution of the He i 471.3 nm emission. In all panels, solid lines denote to the slit at position angle 30°, while the dashed lines give the slit at 150°. The region contaminated by the central star was eliminated. Around 30″ south of the nebula center, the FORS2 instrument has a chip gap.
Current usage metrics show cumulative count of Article Views (full-text article views including HTML views, PDF and ePub downloads, according to the available data) and Abstracts Views on Vision4Press platform.
Data correspond to usage on the plateform after 2015. The current usage metrics is available 48-96 hours after online publication and is updated daily on week days.
Initial download of the metrics may take a while.