Fig. 7
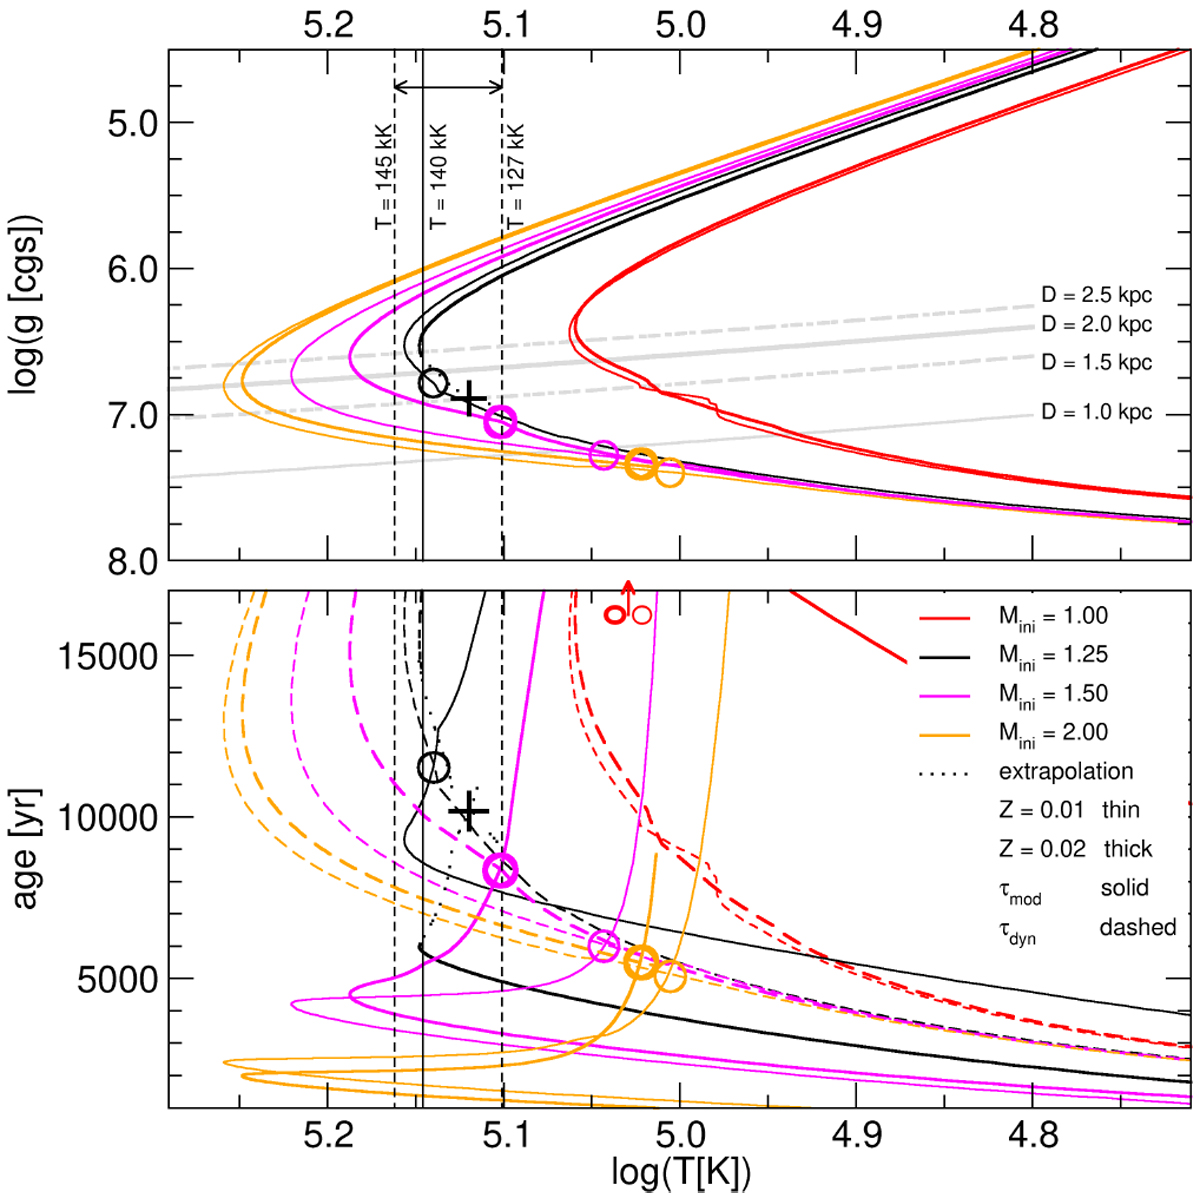
Upper panel: evolutionary tracks of Miller Bertolami (2016) as log(g) vs. log (T) for initial masses of 1.00, 1.25, 1.5 and 2.0 M⊙ (color coded) for metallicities of Z = 0.01 and Z = 0.02 (line thickness coded). The corresponding spectroscopic distances are indicated in light gray. The vertical dark gray lines indicate the range of temperatures as derived from our spectroscopy. Dotted lines mark extrapolation of the track, which ended earlier. Lower panel: computed model ages from the tracks above (solid lines) vs. the dynamical ages (dashed lines). The circles indicate the solutions by intersections of the model age with the dynamical age. The corresponding solutions found in the lower panel are marked in the upper panel as well. Crosses mark the estimated solution of the extrapolated track. The intersections of the 1.0 M⊙ (red) fall faroutside the graph.
Current usage metrics show cumulative count of Article Views (full-text article views including HTML views, PDF and ePub downloads, according to the available data) and Abstracts Views on Vision4Press platform.
Data correspond to usage on the plateform after 2015. The current usage metrics is available 48-96 hours after online publication and is updated daily on week days.
Initial download of the metrics may take a while.