Free Access
Fig. 5
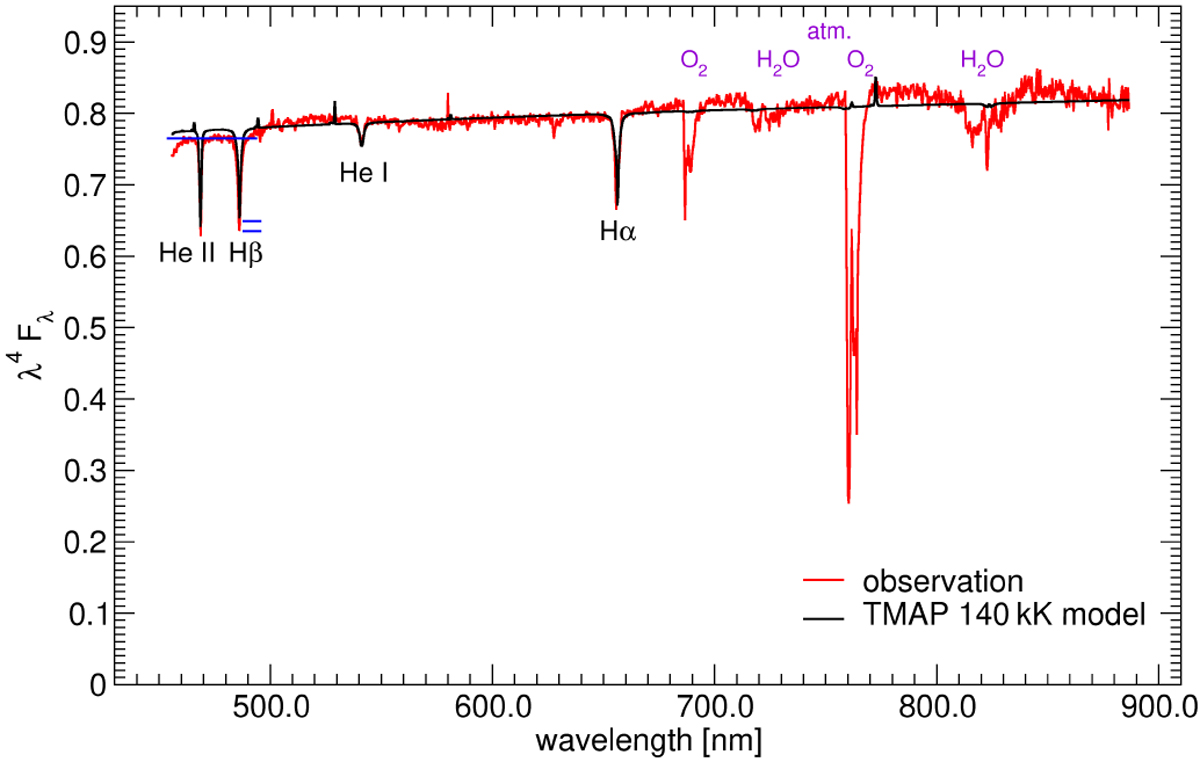
λ4 weighted FORS2 spectrum with the TMAP model. We intentionally did not remove the telluric O2 and H2 O absorptions at the red end of the spectrum. The blue horizontal lines show the required correction of the line depths at the blue end due to the deviation to the continuum.
Current usage metrics show cumulative count of Article Views (full-text article views including HTML views, PDF and ePub downloads, according to the available data) and Abstracts Views on Vision4Press platform.
Data correspond to usage on the plateform after 2015. The current usage metrics is available 48-96 hours after online publication and is updated daily on week days.
Initial download of the metrics may take a while.