Free Access
Fig. 12
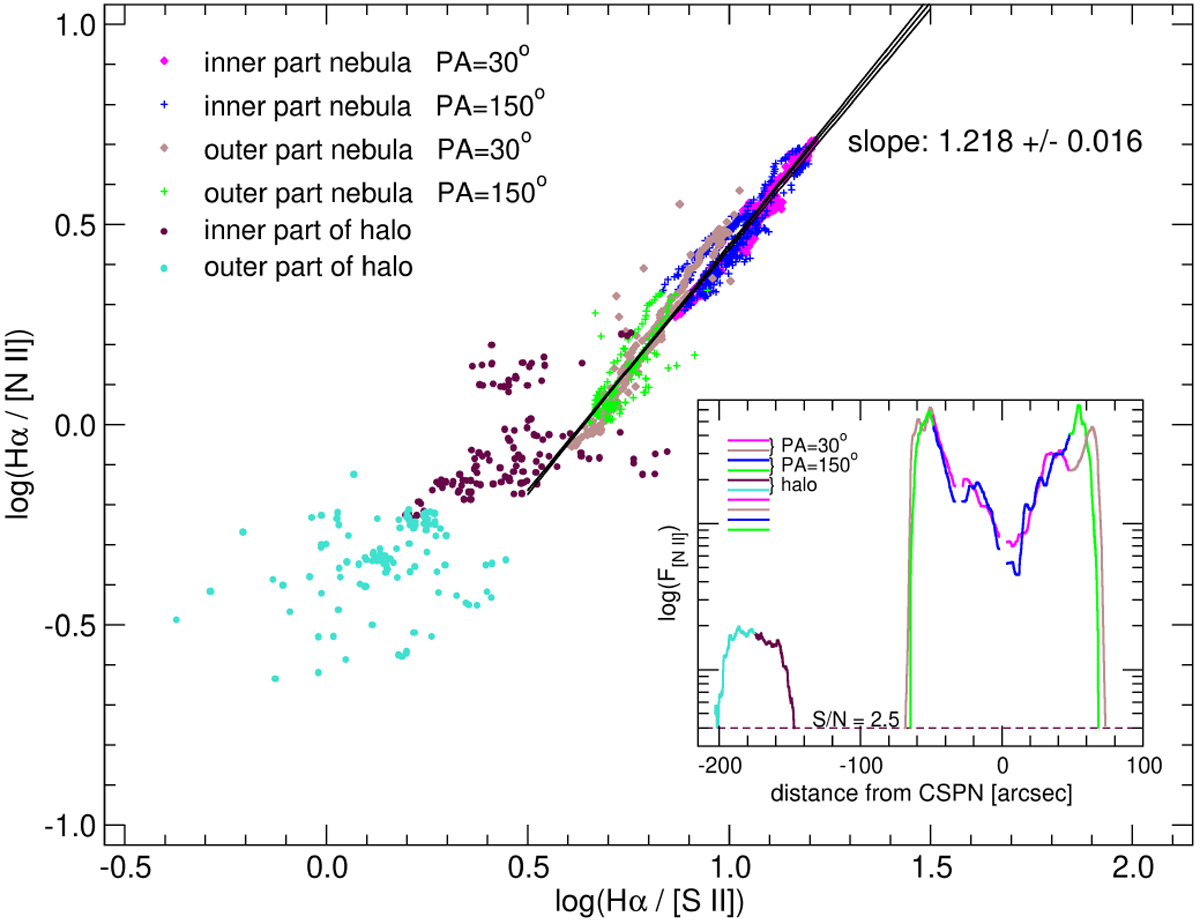
Extended 2D diagnostic diagram of the nebula along the two slits positions and out to the halo in the regions with S/N >3 for all lines included in the graph.
Current usage metrics show cumulative count of Article Views (full-text article views including HTML views, PDF and ePub downloads, according to the available data) and Abstracts Views on Vision4Press platform.
Data correspond to usage on the plateform after 2015. The current usage metrics is available 48-96 hours after online publication and is updated daily on week days.
Initial download of the metrics may take a while.