Fig. 1
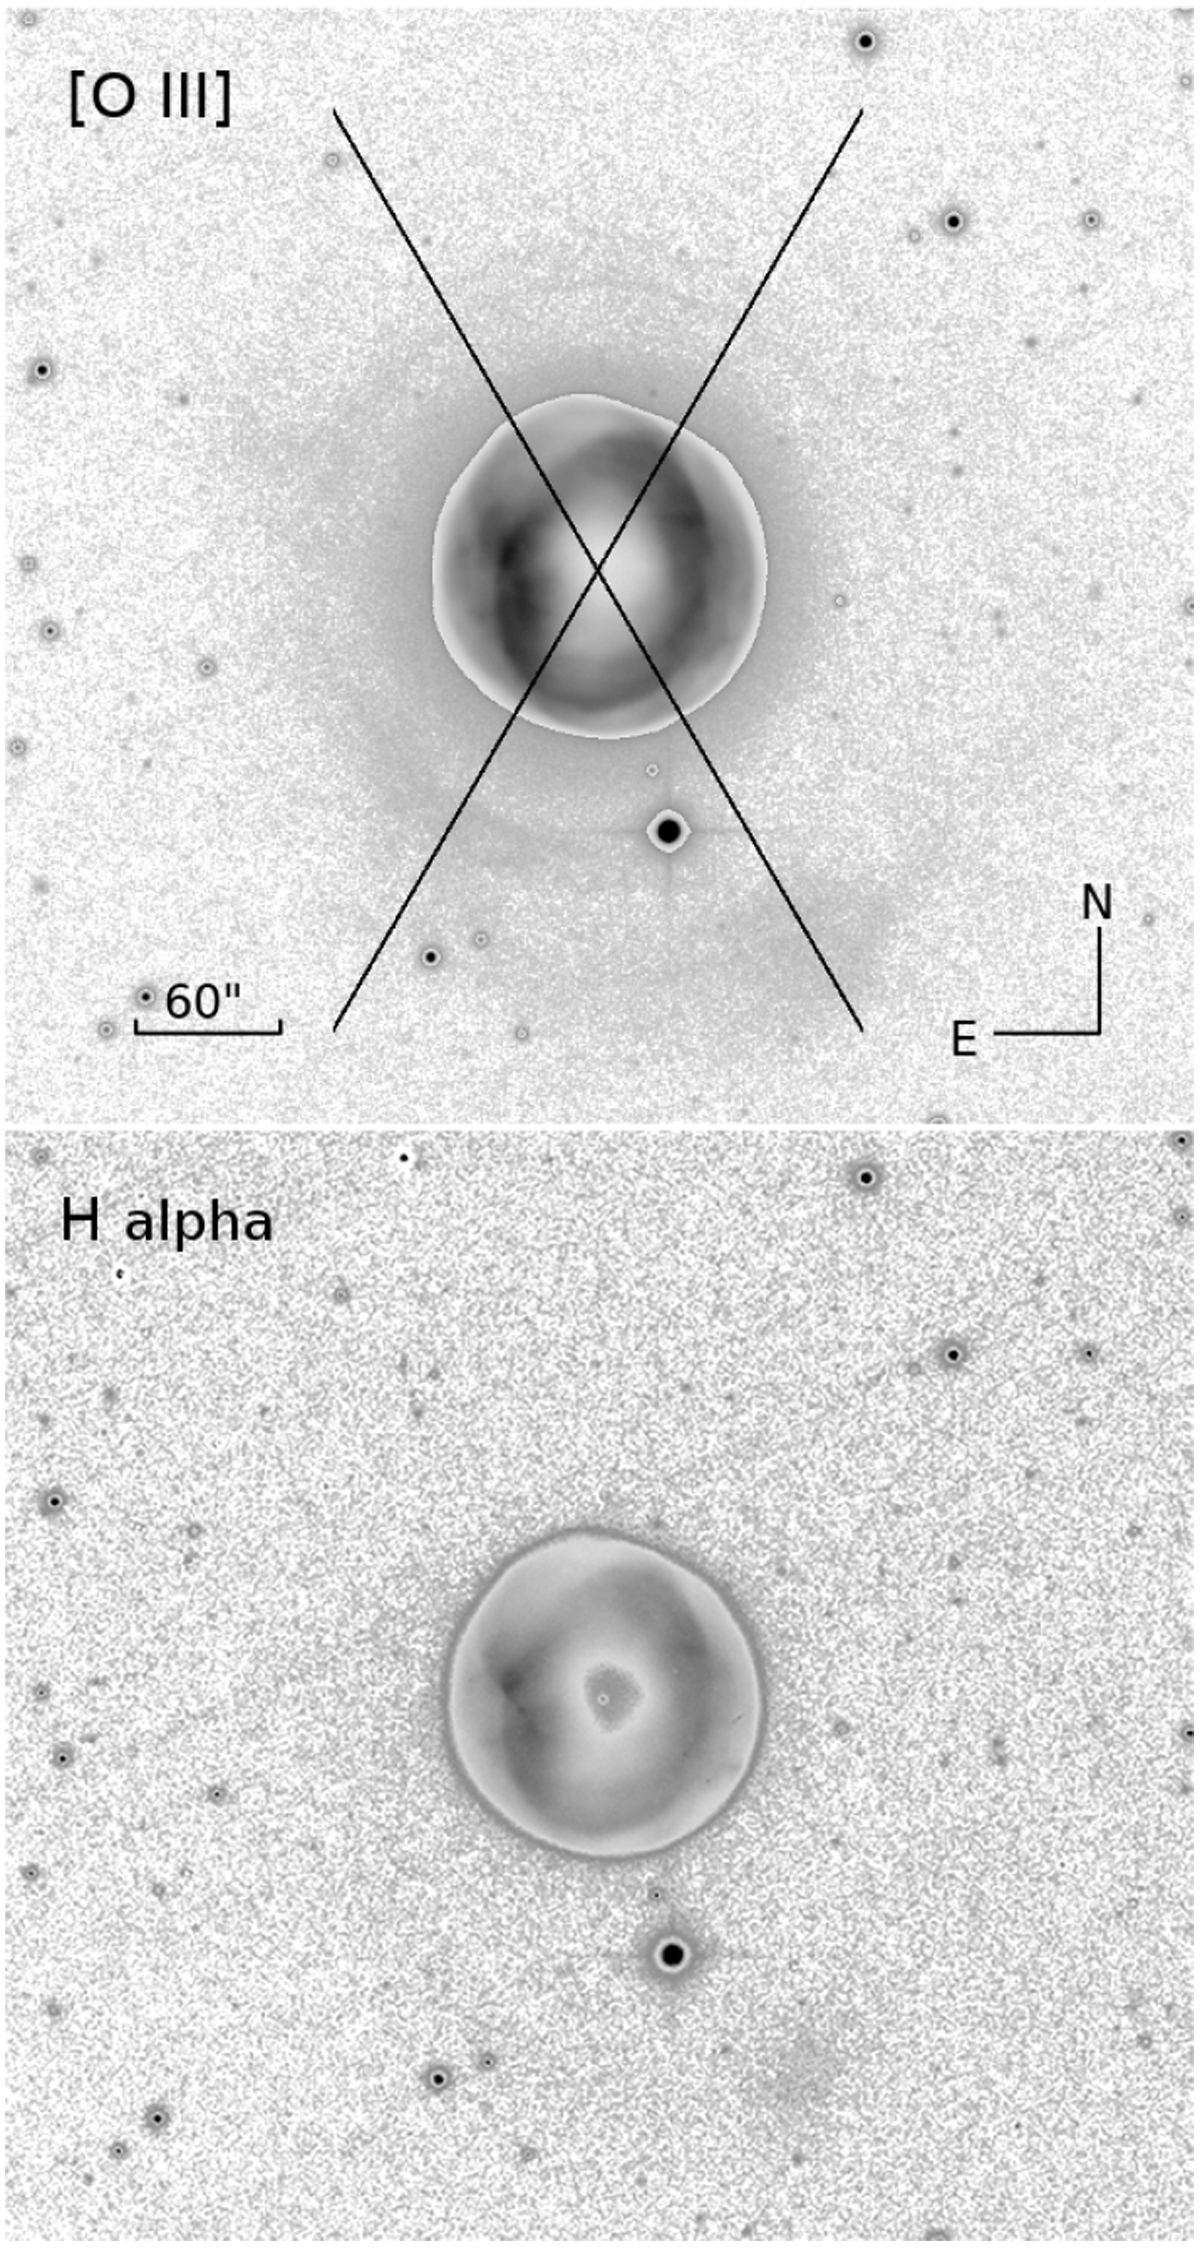
Co-added direct images in [O III] (top panel) and H α (bottom panel). The slit positions of the spectroscopy are indicated in the top panel. While in the inner part, a linear intensity scale covering the whole range from zero to peak flux of the nebula was used, for regions with flux below 5% a steep asinh between 0.01 and 1% of the peak of the linear part was used to enhance the by orders of magnitude fainter structures.
Current usage metrics show cumulative count of Article Views (full-text article views including HTML views, PDF and ePub downloads, according to the available data) and Abstracts Views on Vision4Press platform.
Data correspond to usage on the plateform after 2015. The current usage metrics is available 48-96 hours after online publication and is updated daily on week days.
Initial download of the metrics may take a while.