Fig. 9
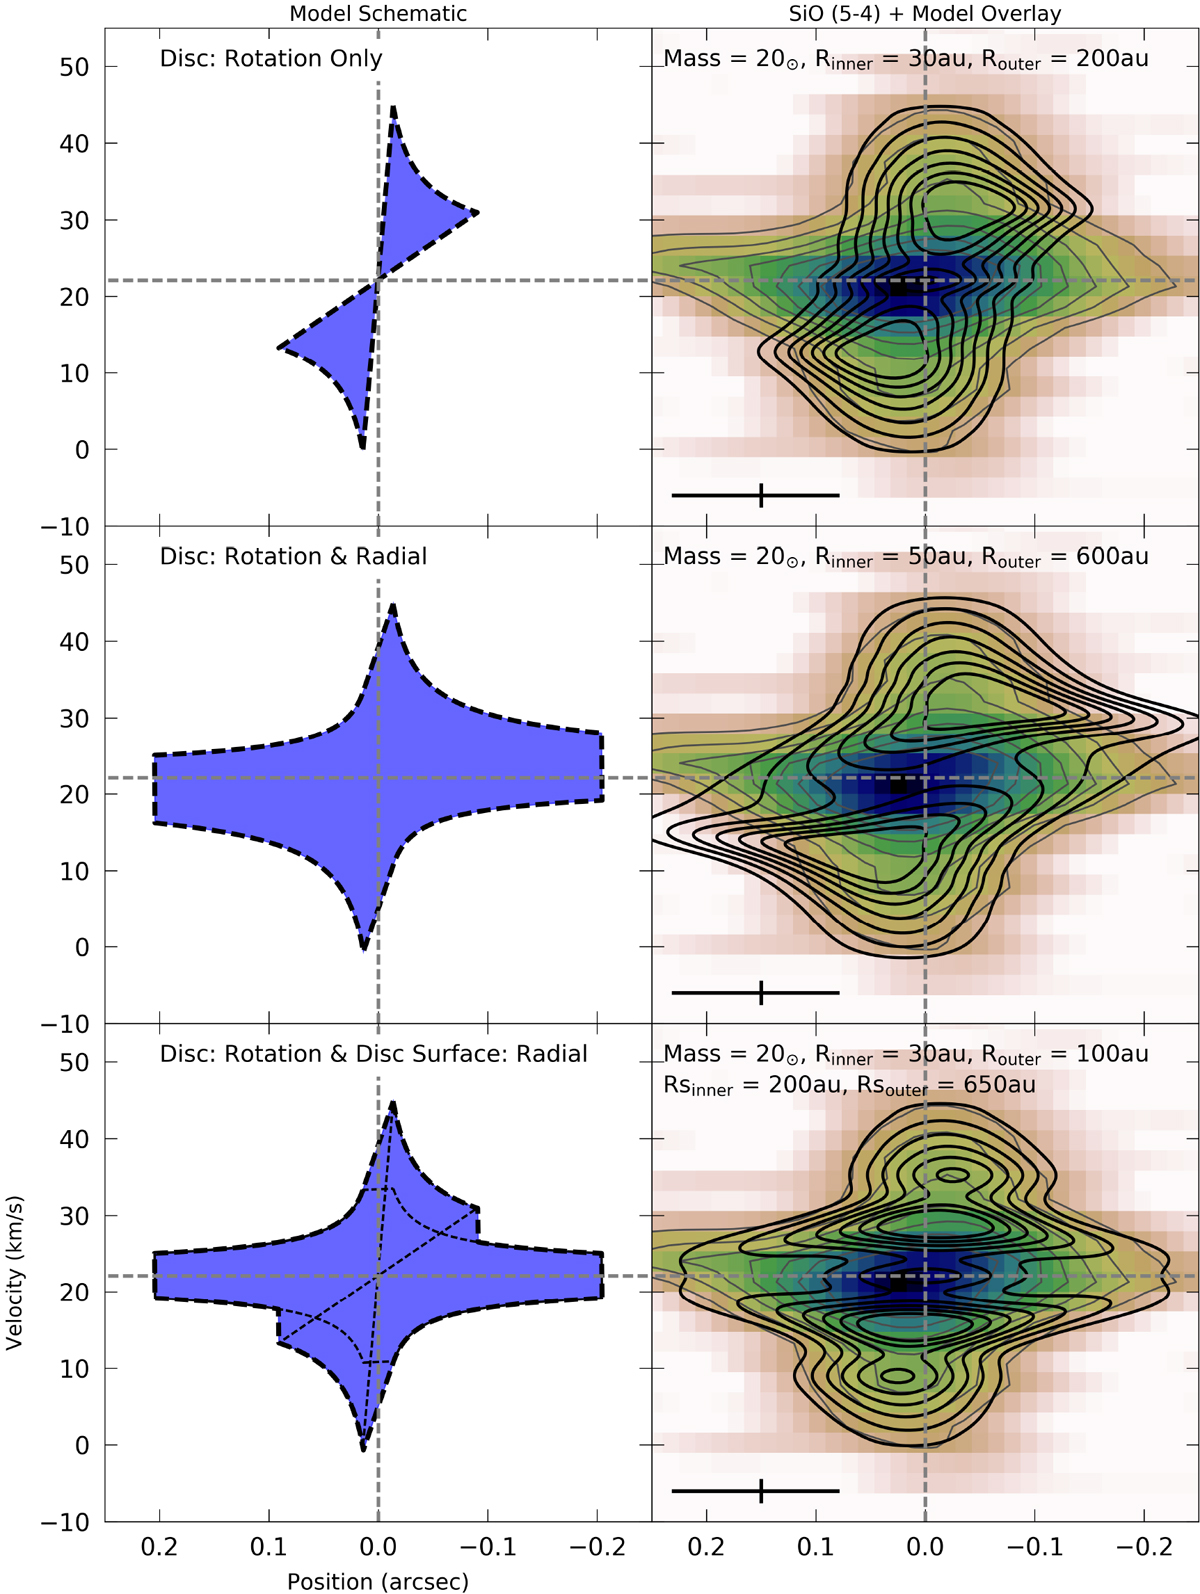
Various models tested as a schematic (left panel) and then as an overlay on the observed SiO data (right panel). From top to bottom: disc model with only rotational velocities; the disc model with rotation and radial velocity motion; and the discwith disc surface model where the disc has rotational motion whereas the surface has radial motion. Both disc only models (top and middle panel) have intensity profiles where most emission is shifted to high velocities and small spatialoffsets, unlike the centrally peaked observations. For the disc model with rotation and radial motion (middle panel), the observer sees the vector sum of the velocity component, such that there is always a resulting velocity offset at larger spatial offsets due to the rotational component. This does not match the data. For models of a rotating disc combined with a disc surface that has radial motion (bottom panel), the velocities from each structure are superposed and thus can represent the entire observed PV diagram (the bottom-left plot shows the Keplerian and radial velocities profiles in the dotted thin line). In all right hand plots the data resolution is shown to the bottom-left while the contours for the data and model are from 20 to 80% in 10% steps of the peak emission. Note the basic models parameters shown in the right plots.
Current usage metrics show cumulative count of Article Views (full-text article views including HTML views, PDF and ePub downloads, according to the available data) and Abstracts Views on Vision4Press platform.
Data correspond to usage on the plateform after 2015. The current usage metrics is available 48-96 hours after online publication and is updated daily on week days.
Initial download of the metrics may take a while.