Fig. 7
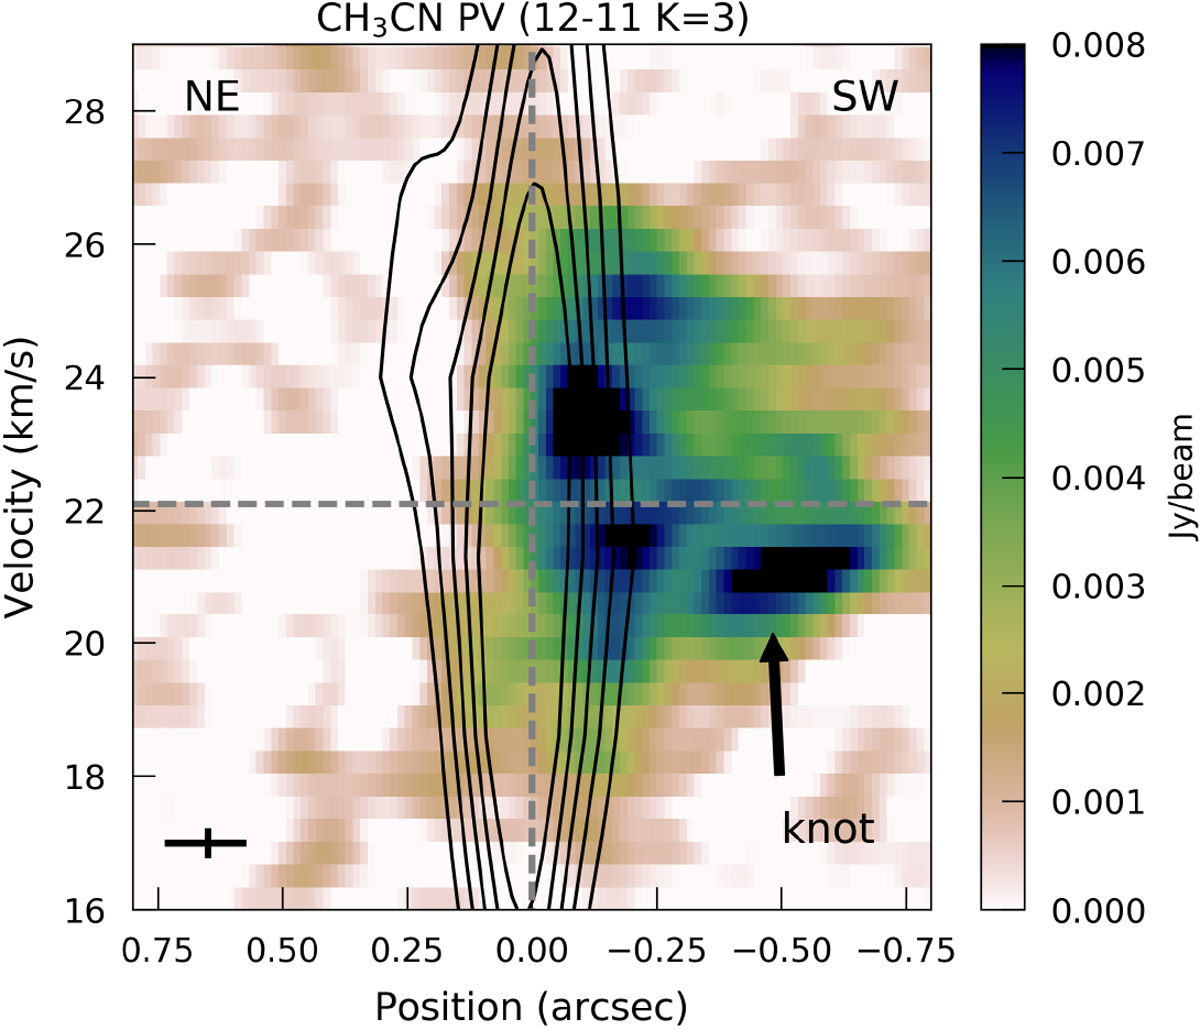
Position-velocity (PV) diagram of the CH3CN (J = 12–11) K = 3 line (colour map) overlaid with the PV diagram of the SiO as in Fig. 4 (black contours). There is notable emission to negative spatial offsets related to a south-west direction along the PV cut, whereas to positives offsets (north-east) there is barely any emission. Both blue- and red-shifted emission coincide to the south-west, related to the signature of either a wide-angle wind, with flows nearly radially, or that there is simultaneous infall from material in front and behind the edge of the disc. The emission at bluer velocities and high negative offset (−0.5″) is associated with the knot structure identified in Fig. 5. The spatial and velocity resolution of the CH3 CN map is shown at the bottom left, while the direction along the PV cut to the NE and SW is indicated at the top.
Current usage metrics show cumulative count of Article Views (full-text article views including HTML views, PDF and ePub downloads, according to the available data) and Abstracts Views on Vision4Press platform.
Data correspond to usage on the plateform after 2015. The current usage metrics is available 48-96 hours after online publication and is updated daily on week days.
Initial download of the metrics may take a while.