Fig. 6
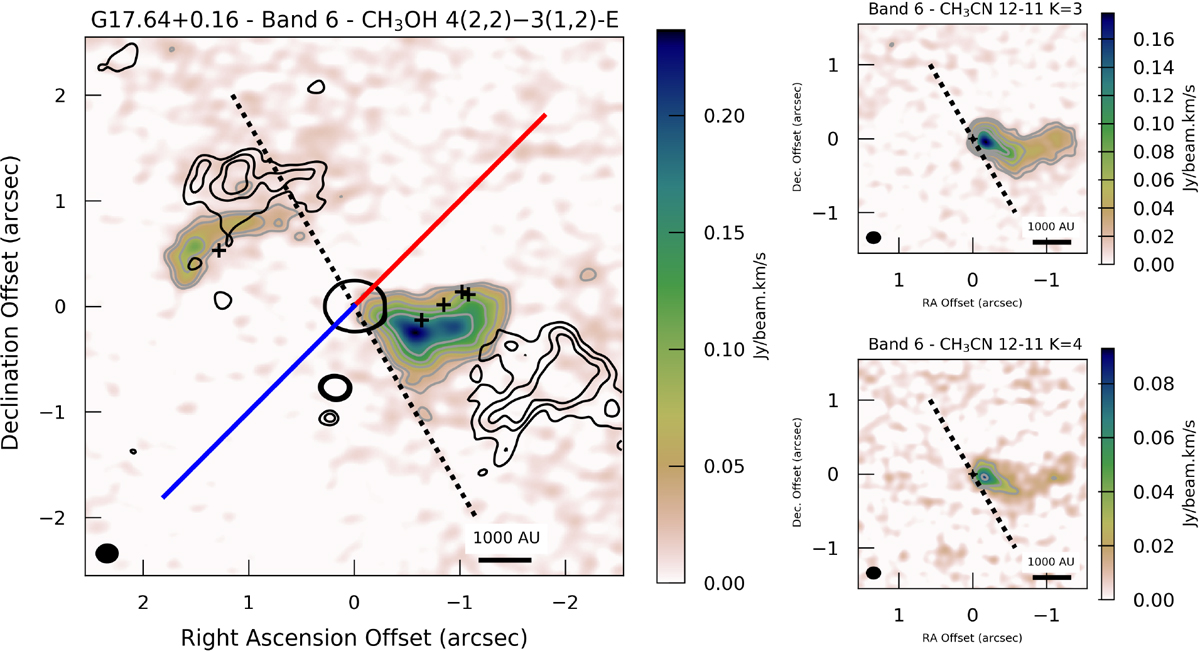
Left panel: moment zero map of the CH3OH line at 218.440 GHz integrated between 19.0 and 23.9 km s−1 (colour map). The contours of the CH3OH emission (grey) are at the 3, 5, 10, 15 and 20 σ level (σ = 7.44 mJy beam−1 km s−1), while those of the continuum emission at the 3, 4 and 5 σ levels are also shown in black (see also Fig. 2). The plume emission both to the east and west curves away from the plane of the proposed SiO disc plane (black dotted line) possibly due to a redirection or collimating of a wide-angle flow to the common CO outflow direction (blue and red solid line). The plus symbols mark the OH masers from Argon et al. (2000). G17.64 is centred at (0,0). Right panel: moment zero maps of CH3 CN (J = 12–11) K = 3 (top panel) and K = 4 (bottom panel) also integrated between 19.0 and 23.9 km s−1 (colour map). The contours are at the 3,5,10,15,20 σ levels (σ = 4.93 mJy beam−1 km s−1 for the K = 3 transition and 7.61 mJy beam−1 km s−1 for the K = 4 transition. The dotted line in all panels is that of the SiO disc plane.
Current usage metrics show cumulative count of Article Views (full-text article views including HTML views, PDF and ePub downloads, according to the available data) and Abstracts Views on Vision4Press platform.
Data correspond to usage on the plateform after 2015. The current usage metrics is available 48-96 hours after online publication and is updated daily on week days.
Initial download of the metrics may take a while.