Fig. 5
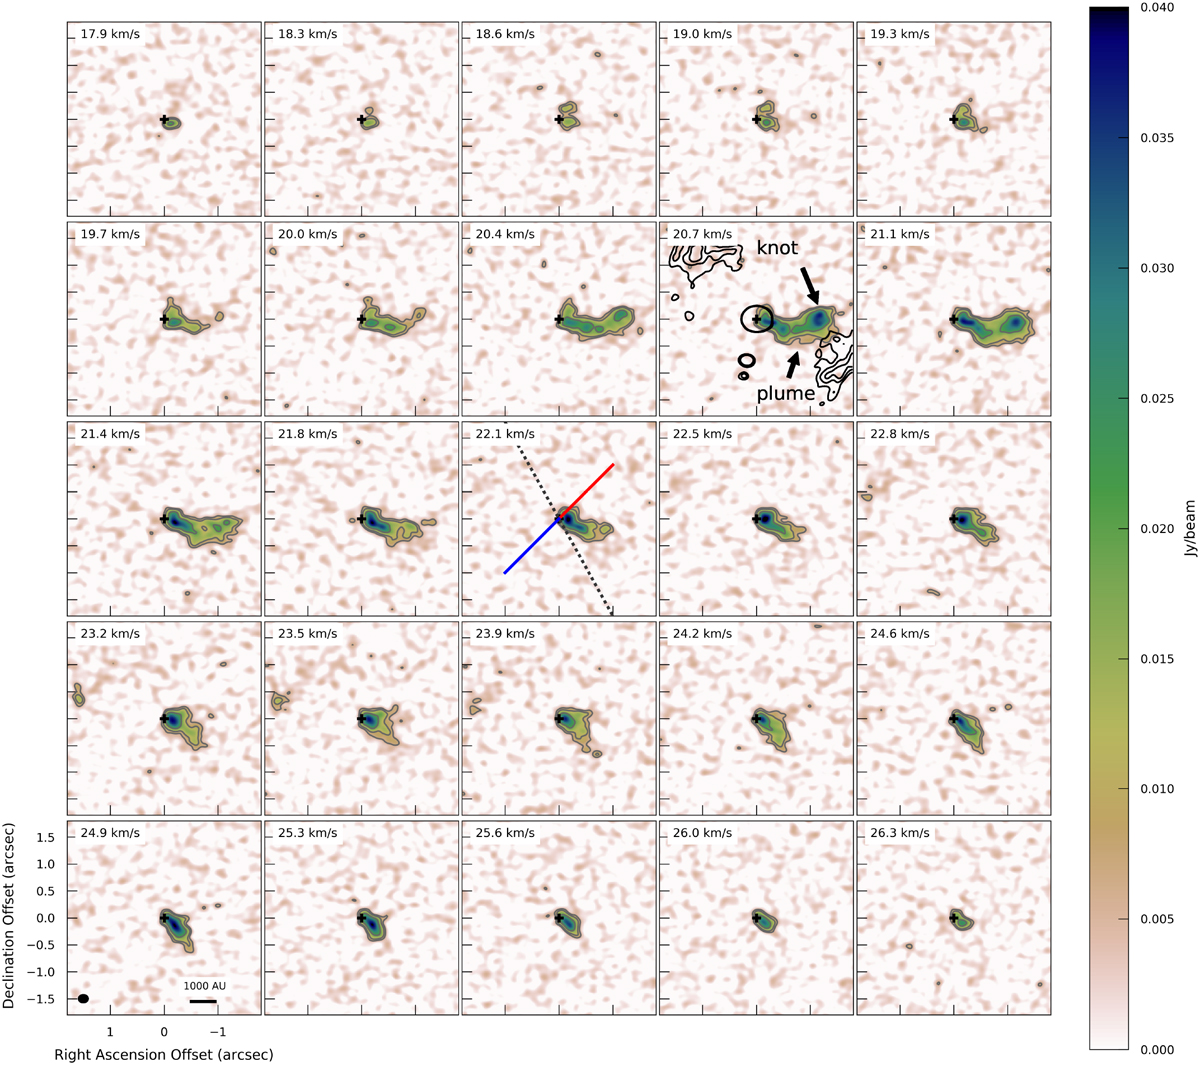
Channel map of the CH3CN (J = 12–11) K = 3 line ranging from 17.9 to 26.3 km s−1 in steps of 0.3 km s−1. The contours of the CH3CN emission are at the 3, 5 and 10 σ level (σ = 2.0 mJy beam−1 chan−1). In the central panel at the VLSR velocity channel (22.1 km s−1) the dotted line indicates the PA of the disc major axis at 30°, while the solid (blue and red) line indicates the outflow direction at a PA of 135°. At all velocities the CH3CN emission is brightest to the south west of the main continuum peak (at 0,0 indicated by the “+” symbol). The plume structure (indicated) is visible between ~19.7 and ~22.5 km s−1 while the knot at the tip of the plume is inward of the diffuse dust emission, potentially indicative of an interaction of outflowing material with the surrouding dust structures. The continuum emission at the 3, 4, 5 σ levels as in Fig. 2 is plotted in black contours in the 20.7 km s−1 channel panel to highlight the diffuse dust emission. A scale bar and synthesised beam are shown in the bottom left panel.
Current usage metrics show cumulative count of Article Views (full-text article views including HTML views, PDF and ePub downloads, according to the available data) and Abstracts Views on Vision4Press platform.
Data correspond to usage on the plateform after 2015. The current usage metrics is available 48-96 hours after online publication and is updated daily on week days.
Initial download of the metrics may take a while.