Fig. 3
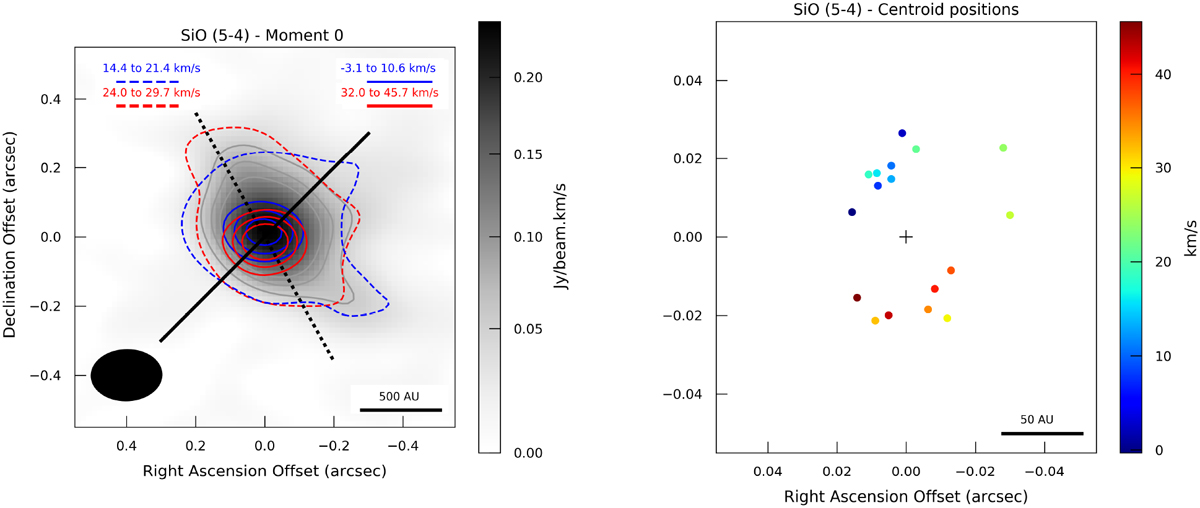
Left panel: moment zero image of the SiO emission integrated over the VLSR between 21.4and 24.0 km s−1. The grey contours highlight the elongated emission and are at the 10, 15 and 20 σ levels (σ = 5.524 mJy beam−1 km s−1). The blue and red solid contours show blue- and red-shifted high velocity SiO emission thought to be tracing the high velocity component, possibly an underlying rotating disc (levels at 10, 15 and 20 σ, where σ = 9.57 and 9.41 mJy beam−1 km s−1 for the blue- and red-shifted high velocity emission) while the dashed lines indicate the 10 σ level (σ = 7.54 and 6.58 mJy beam−1 km s−1 for the blue- and red-shifted emission) attributed to the lower velocity component. The velocity ranges are indicated to the top of the figure, a scale bar to the bottom right, and the synthesised beam to the bottom left. The black solid line is the direction of the outflow at a PA of 135° and the dotted is that of the disc major axis at a PA of 30°, corresponding to the cut used for the PV analysis (see Fig. 4). Right panel: plot of the centroid positions from a 2D Gaussian fitting of each channel from the SiO image cube between −0.3 and 45.6 km s−1, clearly showing that the blue- and red-shifted emission are predominantly to the north-east and south-west, respectively. We note that the scale is changed (by a factor of ten) compared to the left panel. A scale bar is also indicated to the bottom right.
Current usage metrics show cumulative count of Article Views (full-text article views including HTML views, PDF and ePub downloads, according to the available data) and Abstracts Views on Vision4Press platform.
Data correspond to usage on the plateform after 2015. The current usage metrics is available 48-96 hours after online publication and is updated daily on week days.
Initial download of the metrics may take a while.