Fig. 2
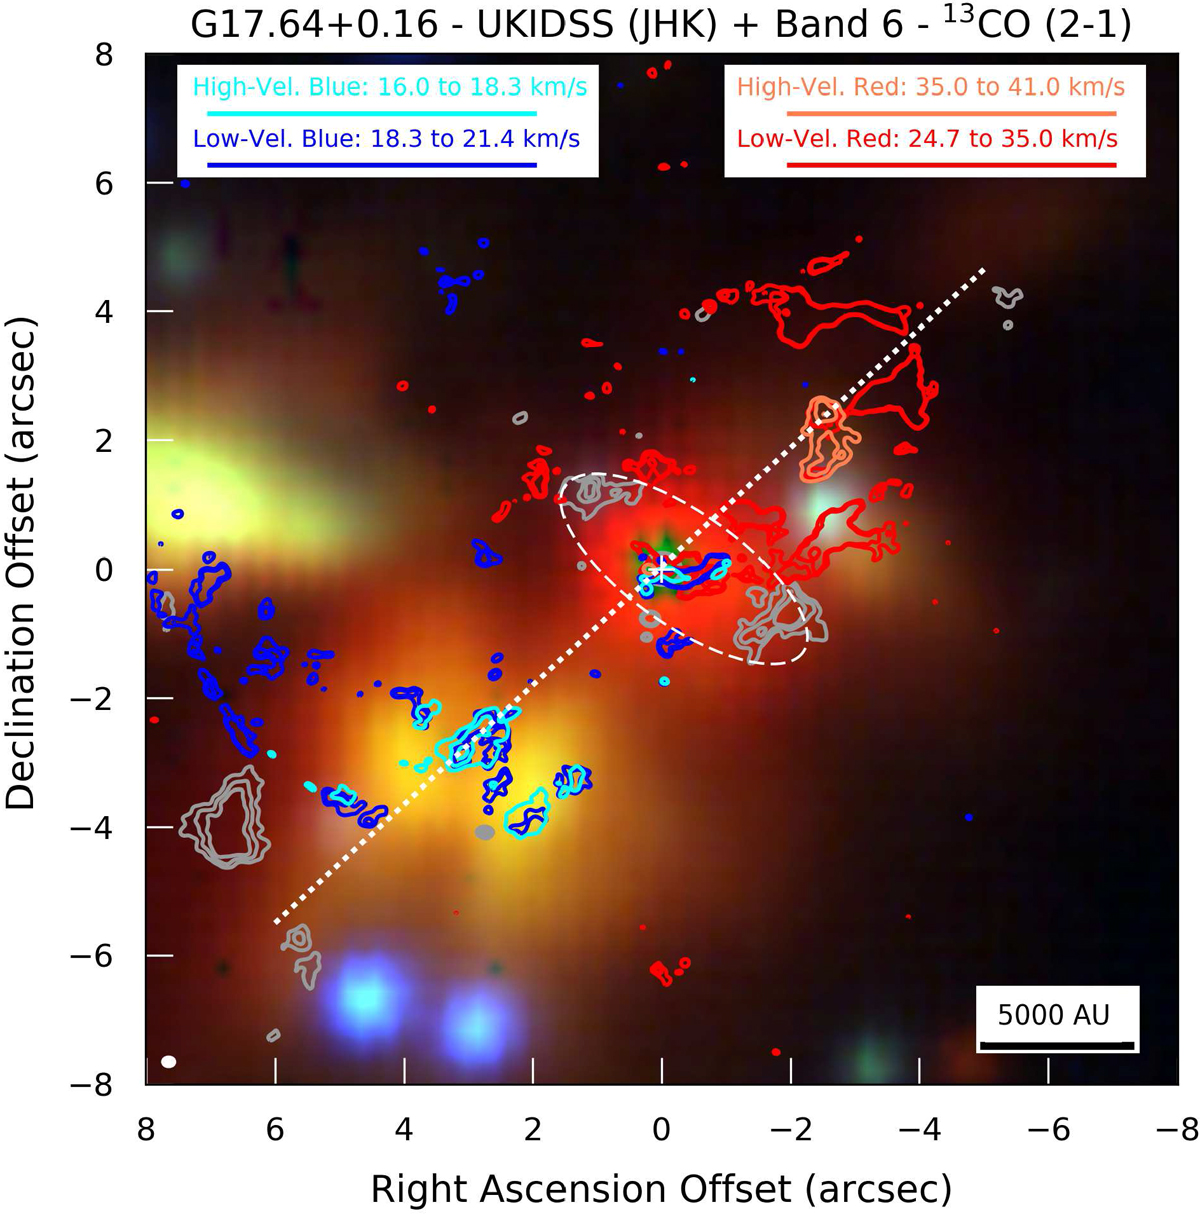
Three colour near-IR composite image made using Ks (2.2 μm, red), H (1.6 μm, green) and J (1.2 μm, blue) images obtained by the UKIDSS overlaid with grey contours of the ALMA band 6 (1.3 mm) continuum emission (robust 1.5 weighting) from the 12 m array only. The contours are at the 3, 4, 5 σ levels (1 σ = 0.16 mJy beam−1) to highlight the weaker emission features. The position of peak continuum emissionfrom G17.64 is indicated by the plus symbol at (0,0) offset (J2000 18h 22m26.385s − 13°30′11.97″) – the continuum contours are not plotted due to the overlap with 13CO contours. In the IR, G17.64 at the centre is the dominant source, while to the east, west and south-east the emission isassociated with the reflection nebula. The white dashed ellipse is indicative of a possible remnant dusty toroid, or underlying dark lane structure. The coloured contours show the moment zero maps of the 13 CO outflow emission integrated over various velocity ranges. The cyan and orange contours show the blue- and red-shifted highest velocity emission integrated from 16.0 to 18.3 km s−1 and 35.0 to 41.0 km s−1, respectively. The contour levels are at 5, 10 and 15 σ, where σ is 3.28 and 4.57 mJy beam−1 km s−1 for the blue- and red-shifted high velocities. The blue and red contours indicate the integration of the lower outflow velocities from 18.3 to 21.4 km s−1 for the blue-shifted emission and from 24.7 to 35.0 km s−1 for the red-shifted emission. We note that the source VLSR = 22.1 km s−1. These contours are at 4 and 5 σ, where σ is 6.25 and 10.06 mJy beam−1 km s−1 for the blue- and red-shifted velocities. The dotted white line indicates the outflow axis at a PA of ~135° (Kastner et al. 1994; Maud et al. 2015b, see also Appendix A) which passes though G17.64 and the points of highest velocity blue- and red-shifted outflow emission along with the IR nebula. A synthesised beam for the mm emission is shown to the bottom-left, a scale bar to the bottom-right, and the legend for the integrated velocities at the top. The primary beam cut off is beyond the map extent.
Current usage metrics show cumulative count of Article Views (full-text article views including HTML views, PDF and ePub downloads, according to the available data) and Abstracts Views on Vision4Press platform.
Data correspond to usage on the plateform after 2015. The current usage metrics is available 48-96 hours after online publication and is updated daily on week days.
Initial download of the metrics may take a while.