Fig. A.3
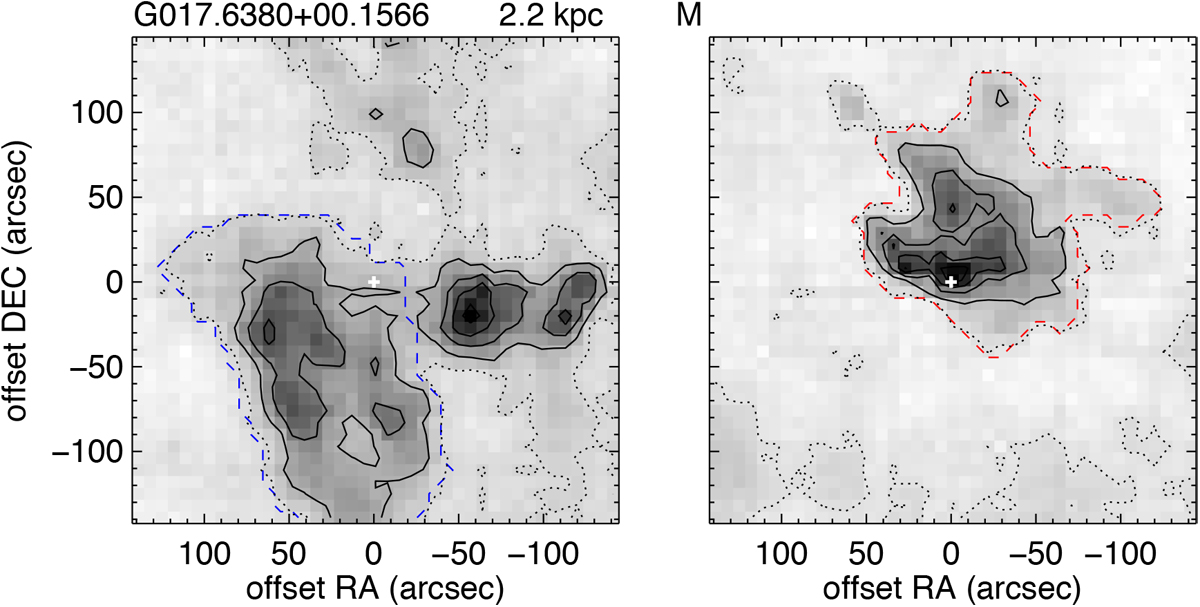
Maps of the blue- (left panel) and red-shifted (right panel) 12CO (3-2) emission analysed as part of the JCMT outflow survey conducted by Maud et al. (2015b). The integrated ranges for the blue- and red-shifted emission are 6.0–20.0 km s−1 and 25.9–38.2 km s−1. These mapsindicate the size of the emission thought to be associated with the outflow as compared with our ALMA ACA and TP data in Fig. A.2.
Current usage metrics show cumulative count of Article Views (full-text article views including HTML views, PDF and ePub downloads, according to the available data) and Abstracts Views on Vision4Press platform.
Data correspond to usage on the plateform after 2015. The current usage metrics is available 48-96 hours after online publication and is updated daily on week days.
Initial download of the metrics may take a while.