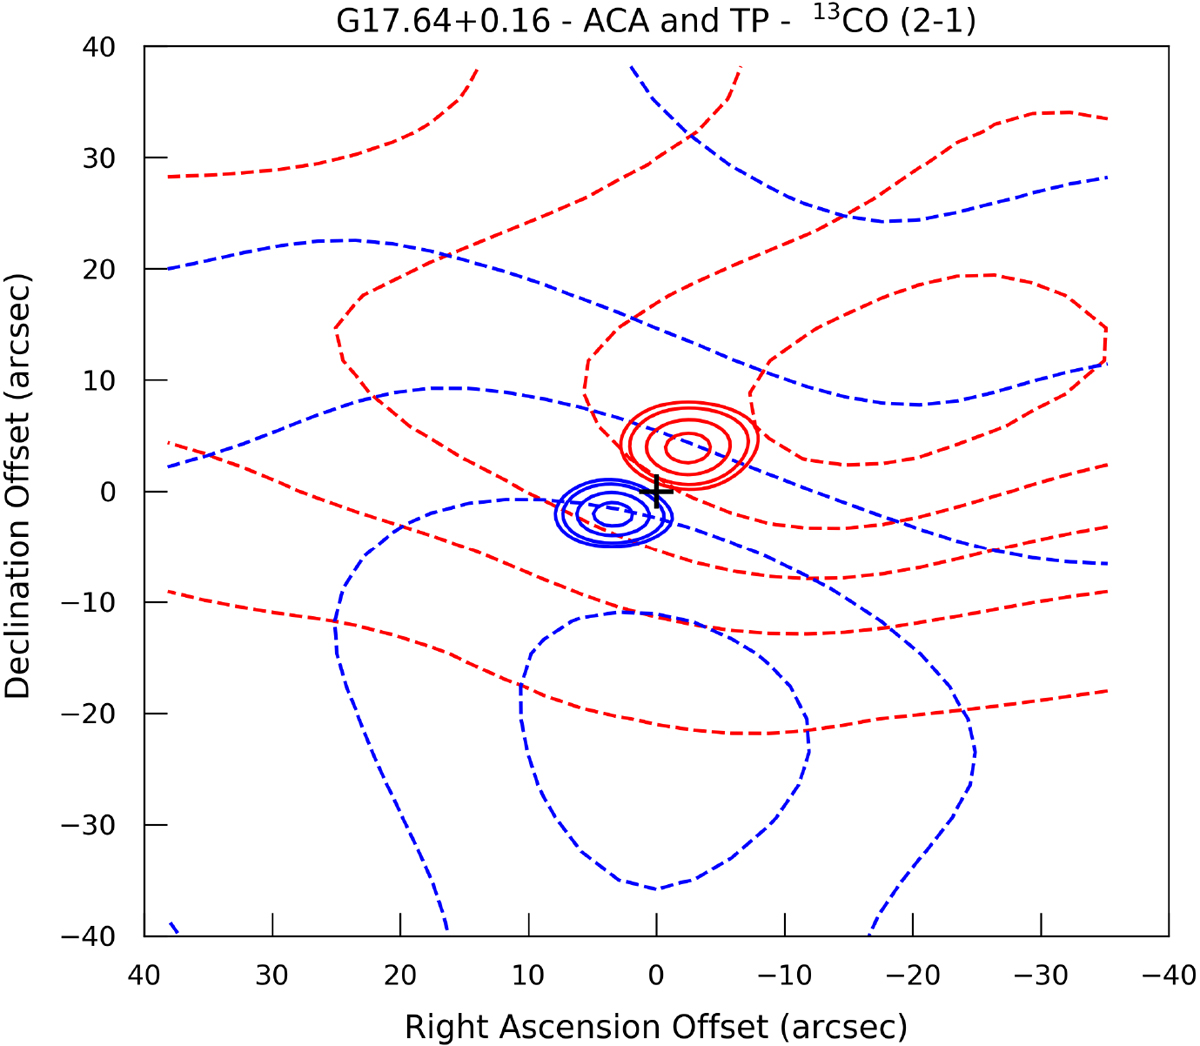
Fig. A.2

Contour plot of the 13CO outflow emission from the ACA (solid) and TP (dashed) observations. The blue- and red-shifted velocities are 18.5–20.1 kms−1 and 28.5–30.5 km s−1, respectively.The ACA contours are at 40, 50, 70 and 90% of the peak value, while the total power are at 10, 30, 50, 70 and 90% of the peak value. The plot is illustrative of the blue and red shift offset emission that forms the outflow, but also shows that the TP does not map a large enough region to fully map the entire CO emission.
Current usage metrics show cumulative count of Article Views (full-text article views including HTML views, PDF and ePub downloads, according to the available data) and Abstracts Views on Vision4Press platform.
Data correspond to usage on the plateform after 2015. The current usage metrics is available 48-96 hours after online publication and is updated daily on week days.
Initial download of the metrics may take a while.


