Fig. A.1
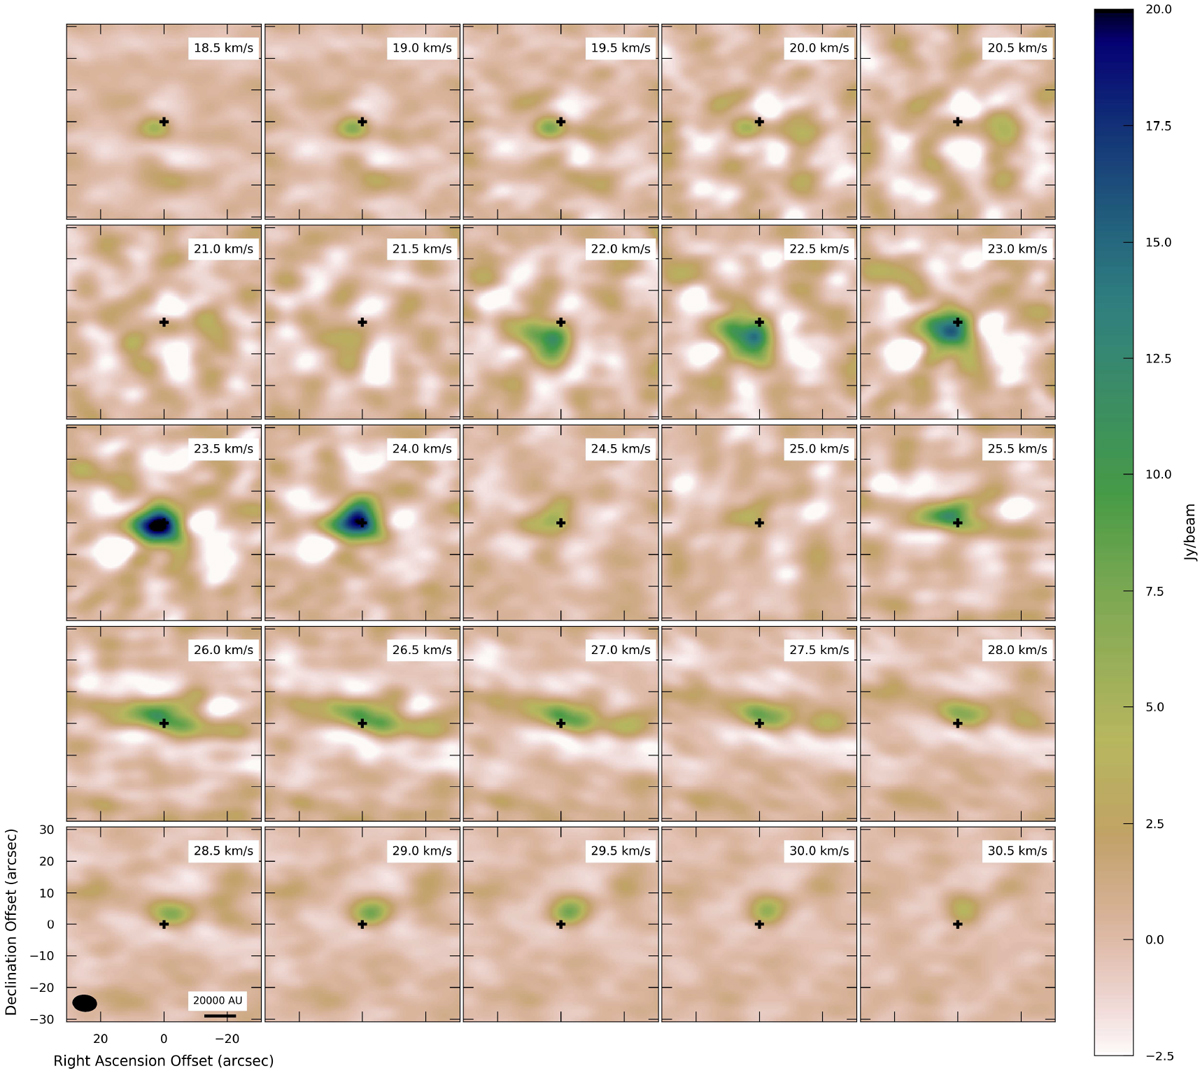
Channel map of the ACA 13CO emission ranging from 18.5 to 30.5 km s−1 in steps of 0.5 km s−1. Recall the source VLSR is 22.1 km s−1. Note the highest velocities of the outflow in the blue- and red-shifted emission occur to the south-east and north-west, respectively, perpendicular to the putative disc. The blue-shifted emission is detected down to 16.9 km s−1 but is co-spatial with that shown at 18.5 km s−1, while the red-shifted emission is detected to 35.6 km s−1 but is the same structure as the panel at 30.5 km s−1.
Current usage metrics show cumulative count of Article Views (full-text article views including HTML views, PDF and ePub downloads, according to the available data) and Abstracts Views on Vision4Press platform.
Data correspond to usage on the plateform after 2015. The current usage metrics is available 48-96 hours after online publication and is updated daily on week days.
Initial download of the metrics may take a while.