Fig. 10
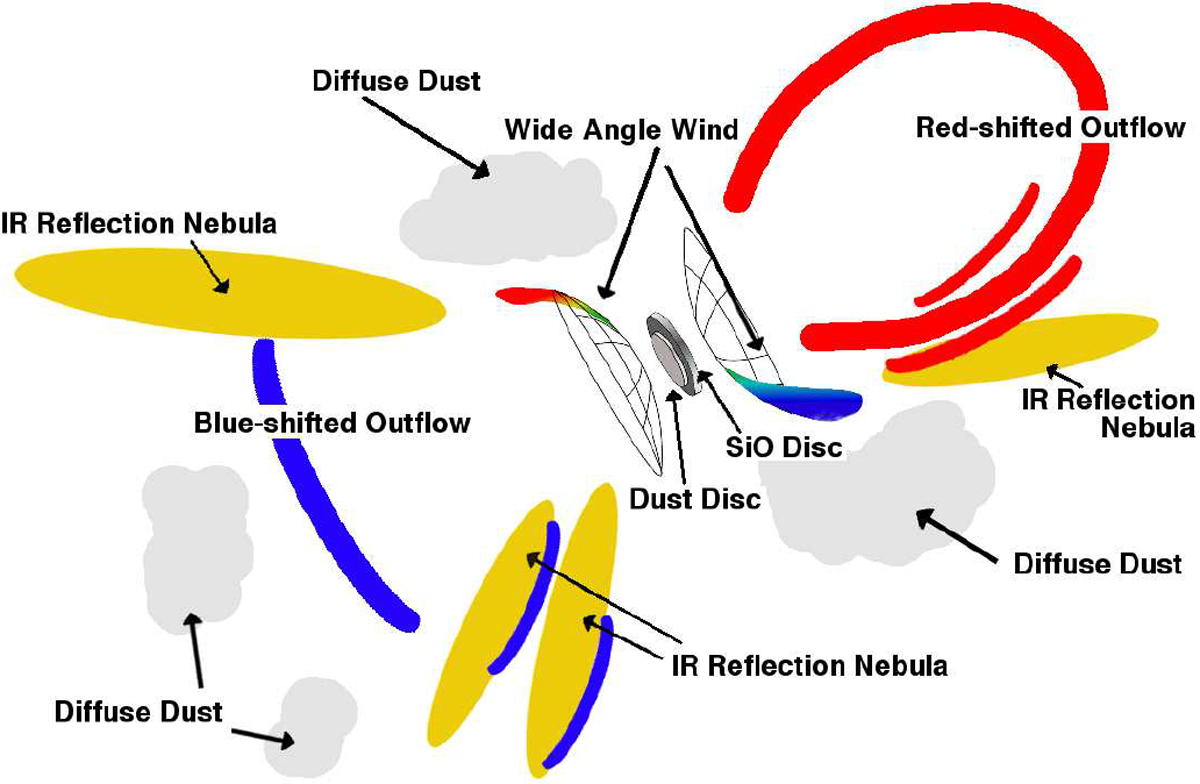
Schematic view of G17.64 and the surrounding region (not to scale). All main features are identified with labels. The dust disc is drawn to have a smaller size compared with the SiO disc in line with the presented observations as we resolve the SiO emission but not the dust emission. For the wide-angle wind, the colours indicate the rough velocity of the molecular tracers we detect at the interaction with the inner edge of the dust structures. The emission to the west is blue shifted, tracing the wide-angle wind directed almost directly towards us, while in the east it is red-shifted as we see emission from the back edge of the cavity. In addition, note the arc shape of the blue-shifted emission to the south-east which is traced by 13 CO (see Fig. 2), CH3CN and CH3OH. For orientation north is up and east is left.
Current usage metrics show cumulative count of Article Views (full-text article views including HTML views, PDF and ePub downloads, according to the available data) and Abstracts Views on Vision4Press platform.
Data correspond to usage on the plateform after 2015. The current usage metrics is available 48-96 hours after online publication and is updated daily on week days.
Initial download of the metrics may take a while.