Fig. 1
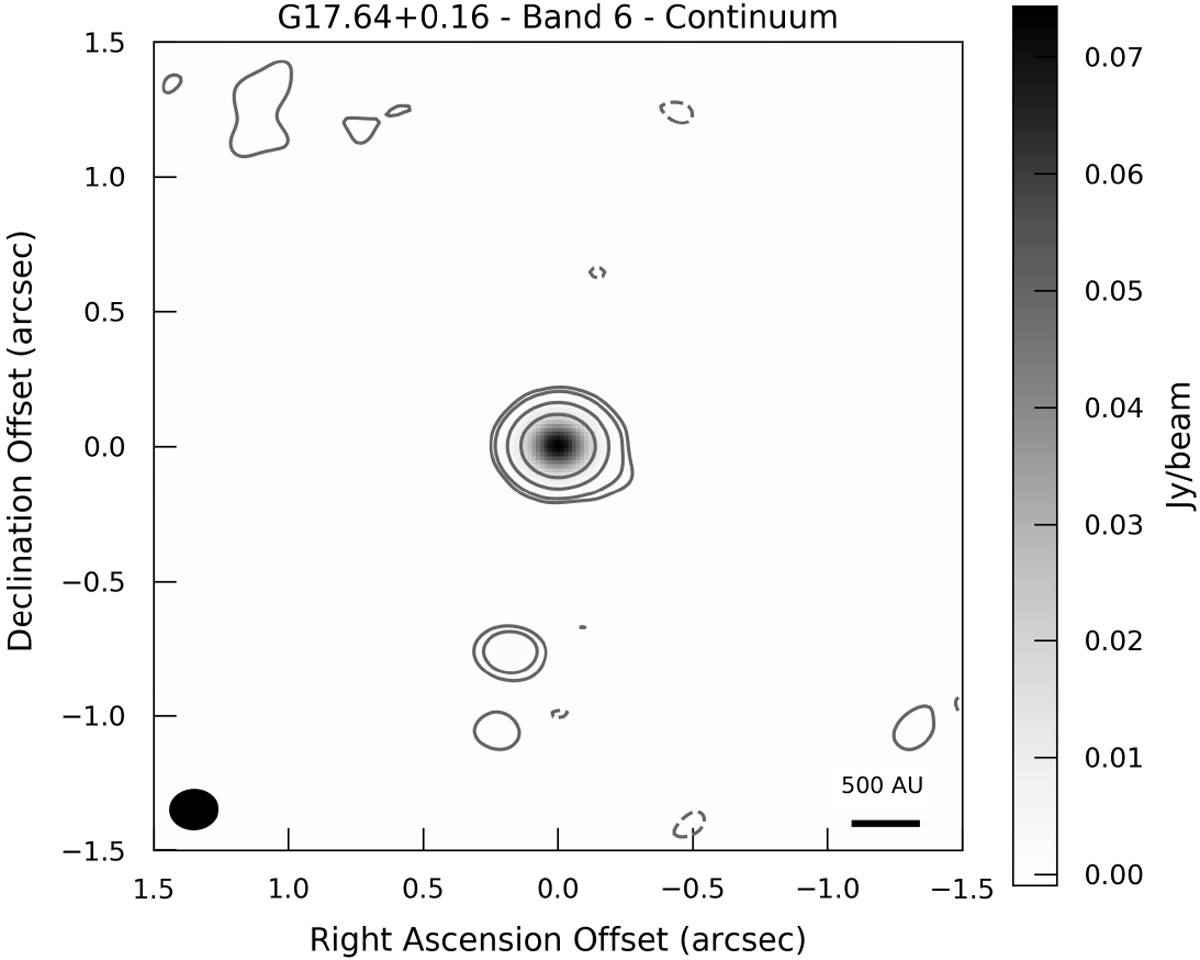
ALMA band 6 (1.3 mm) continuum image of G17.64 made with a robust 0.5 value. The contour levels are set at −3, 5, 10, 50 and 200 σ (1 σ = 0.07 mJy beam−1) to indicate the weak southern sources and the strength of G17.64 (negative contours are dashed lines). The map is centred (0,0) on G17.64 at J2000 18h 22m26.385s −13°30′11.97″. The synthesised beam is indicated to the bottom left of the figure, while a scale bar is shown in the bottom right.
Current usage metrics show cumulative count of Article Views (full-text article views including HTML views, PDF and ePub downloads, according to the available data) and Abstracts Views on Vision4Press platform.
Data correspond to usage on the plateform after 2015. The current usage metrics is available 48-96 hours after online publication and is updated daily on week days.
Initial download of the metrics may take a while.