Fig. 4.
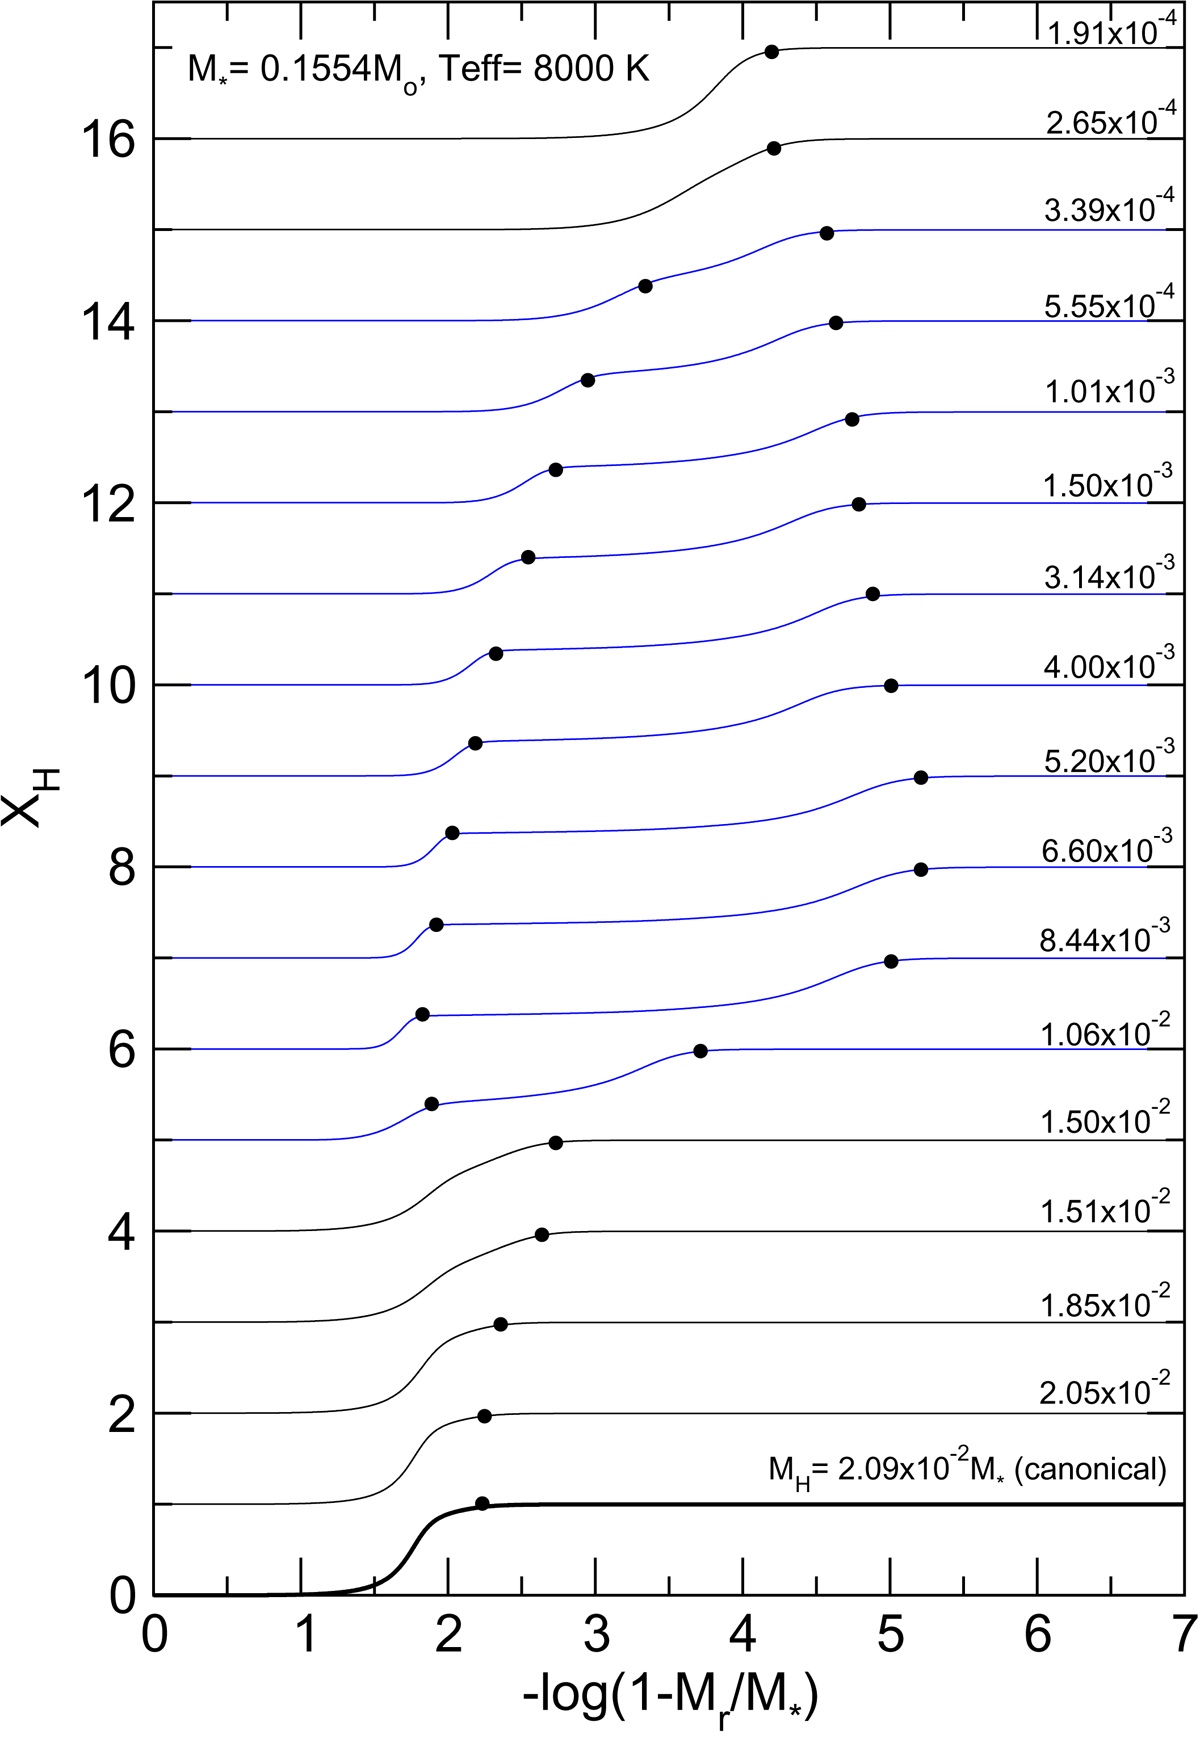
Fractional abundance of H (XH) versus the outer mass fraction coordinate, for ELM WD models with M⋆ = 0.1554 M⊙ and Teff = 8000 K. The lowest curve (thick black) corresponds to a model characterized by the thickest (canonical) envelope for this stellar mass, while the upper curves (which have been artificially displaced upwards for clarity) correspond to models with H envelopes having decreasing thicknesses. The values of MH are shown at the right of the figure. Black (blue) curves correspond to the case of H envelopes with single-layered (double-layered) chemical structures. Black dots indicate the location of each step in the chemical profile.
Current usage metrics show cumulative count of Article Views (full-text article views including HTML views, PDF and ePub downloads, according to the available data) and Abstracts Views on Vision4Press platform.
Data correspond to usage on the plateform after 2015. The current usage metrics is available 48-96 hours after online publication and is updated daily on week days.
Initial download of the metrics may take a while.