Fig. 1.
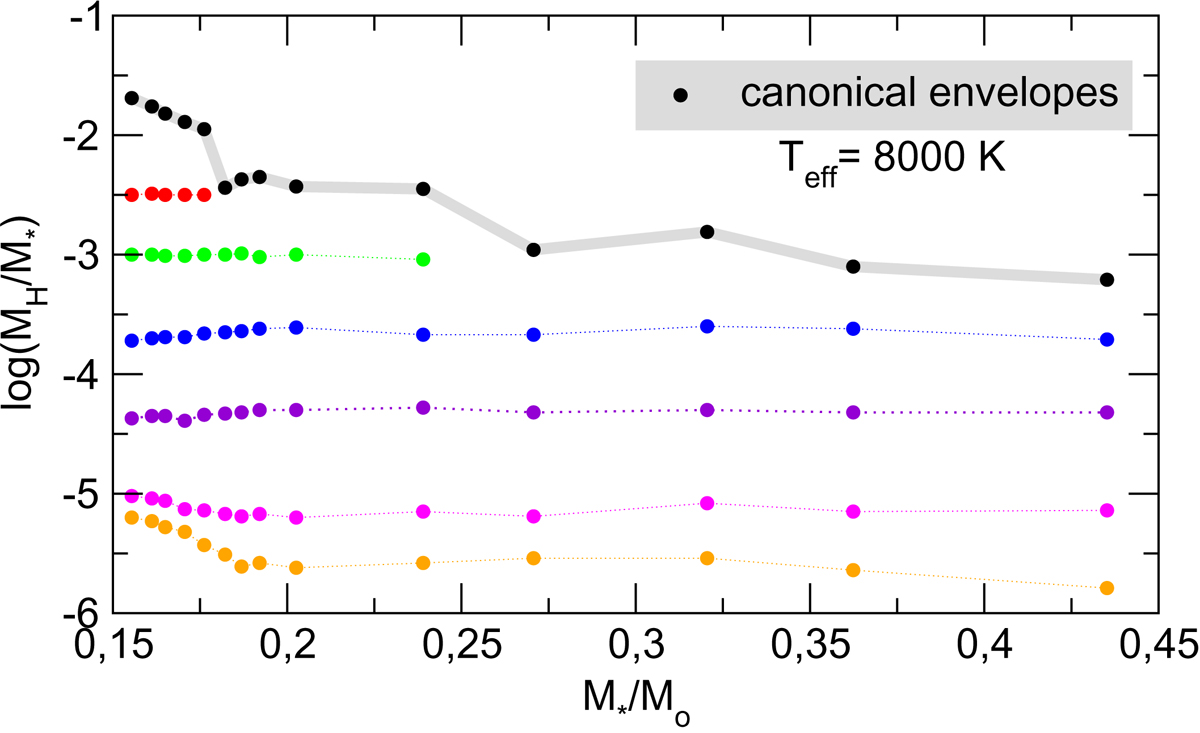
Grid of low-mass He-core WD evolutionary sequences considered in this work shown in the M⋆ − log(MH/M⋆) plane. The small circles represent each sequence of WD models with a given stellar mass and a specific thickness of the H envelope at Teff ∼ 8000 K. The black circles connected by a thick (gray) line correspond to the values of the maximum H envelope thickness as predicted by the evolutionary computations of Althaus et al. (2013). For each sequence, we have pulsationally analyzed about 200 stellar models covering the interval of Teff between 6000 and 10 000 K.
Current usage metrics show cumulative count of Article Views (full-text article views including HTML views, PDF and ePub downloads, according to the available data) and Abstracts Views on Vision4Press platform.
Data correspond to usage on the plateform after 2015. The current usage metrics is available 48-96 hours after online publication and is updated daily on week days.
Initial download of the metrics may take a while.