Free Access
Fig. 2.
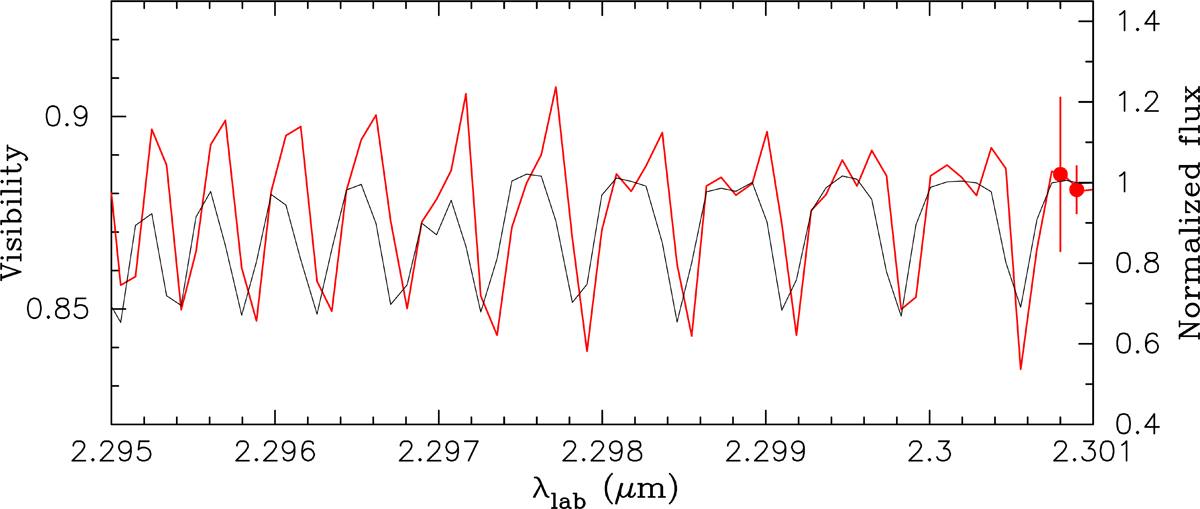
Enlarged view of the visibility in the CO lines observed at the shortest baseline of 7.3 m (red line). It shows asymmetry with respect to the line center. The typical errors are shown in the right in the same manner as in Fig. 1. The scaled observed spectrum is shown with the black line.
Current usage metrics show cumulative count of Article Views (full-text article views including HTML views, PDF and ePub downloads, according to the available data) and Abstracts Views on Vision4Press platform.
Data correspond to usage on the plateform after 2015. The current usage metrics is available 48-96 hours after online publication and is updated daily on week days.
Initial download of the metrics may take a while.