Fig. 1.
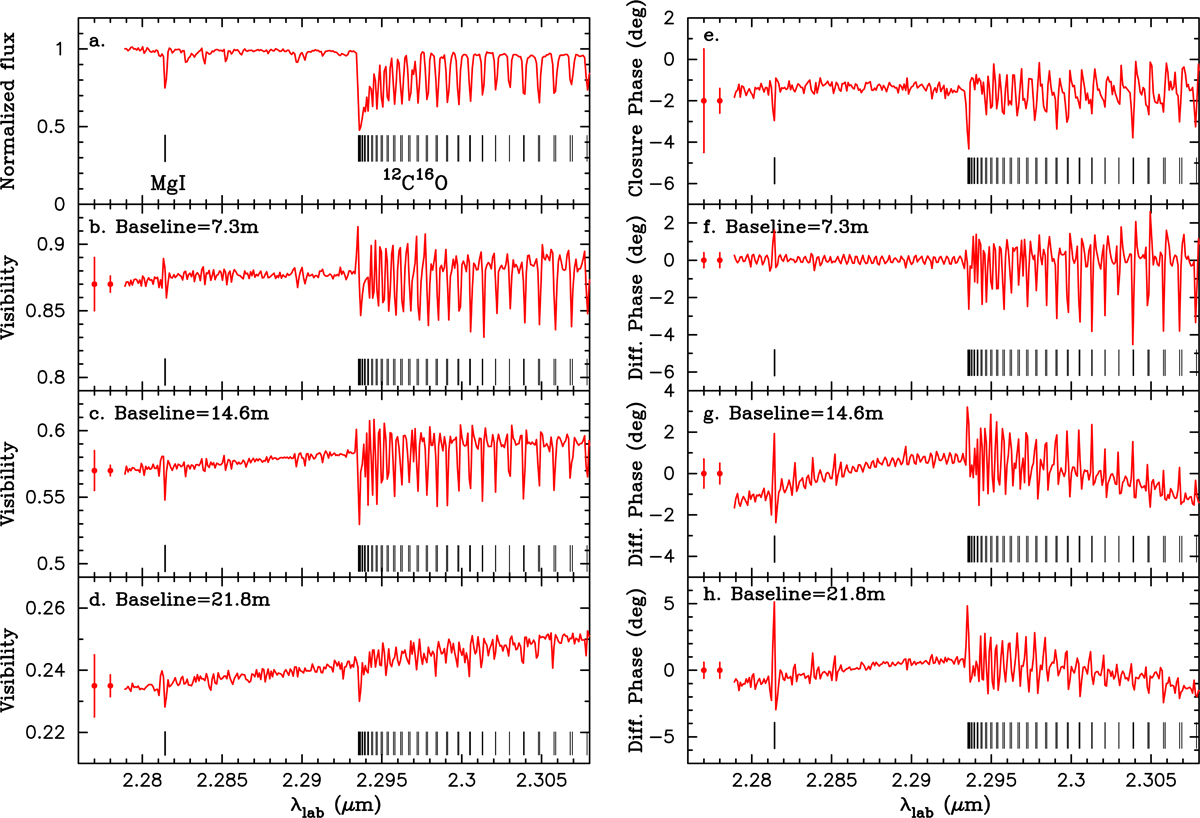
VLTI/AMBER observations of the red giant Arcturus. Panel a: observed spectrum normalized to the continuum. The positions of the CO lines and the Mg I line are marked with the ticks. Panels b–d: visibilities observed at 7.3, 14.6, and 21.8 m, respectively. The leftmost error bars represent the typical total errors, while the smaller error bars represent the typical errors without the systematic errors resulting from the absolute calibration. Panel e: observed closure phase. The errors are shown in the same manner as in panels b–d. Panels f–h: differential phases observed at the 7.3, 14.6, and 21.8 m baselines, respectively. The errors are shown in the same manner as in panels b–d.
Current usage metrics show cumulative count of Article Views (full-text article views including HTML views, PDF and ePub downloads, according to the available data) and Abstracts Views on Vision4Press platform.
Data correspond to usage on the plateform after 2015. The current usage metrics is available 48-96 hours after online publication and is updated daily on week days.
Initial download of the metrics may take a while.