Fig. 5.
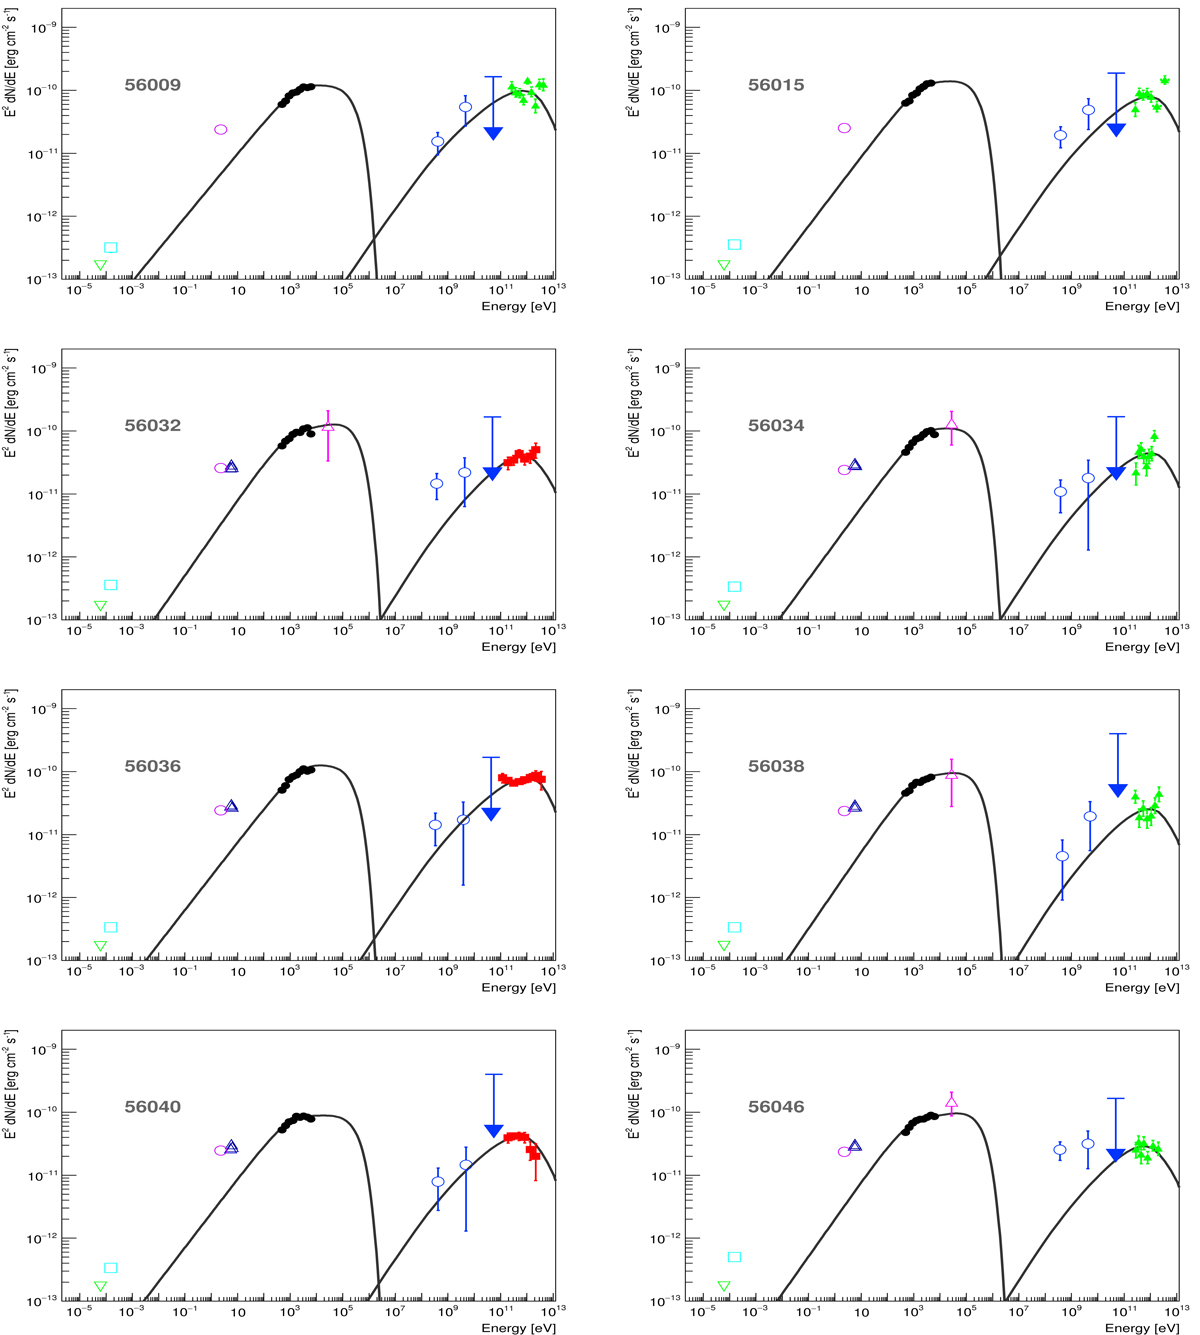
Spectral energy distributions (SED) for 8 observations between MJD 56009 and MJD 57046. The markers match the following experiments; the green open triangle OVRO (radio 15 GHz), blue open square Metsähovi (radio 37 GHz), red open circle (R-band optical, corrected for host galaxy), blue open triangles Swift/UVOT (UV), black filled circles Swift/XRT (X–ray), pink open triangles Swift/BAT (X–ray), blue open circles Fermi-LAT (gamma rays) and red/green filled squares/triangles MAGIC/VERITAS (VHE gamma rays). VHE data are EBL–corrected using Franceschini et al. (2008). The BAT energy flux relates to a one-day average, while the Fermi-LAT energy flux relates to three-day average centered at the VHE observation. Filled markers are those fit by the theoretical model, while open markers are not. The black line represents the best fit with a one–zone SSC model, with the results of the fit reported in Table 2.
Current usage metrics show cumulative count of Article Views (full-text article views including HTML views, PDF and ePub downloads, according to the available data) and Abstracts Views on Vision4Press platform.
Data correspond to usage on the plateform after 2015. The current usage metrics is available 48-96 hours after online publication and is updated daily on week days.
Initial download of the metrics may take a while.