Free Access
Fig. 7.
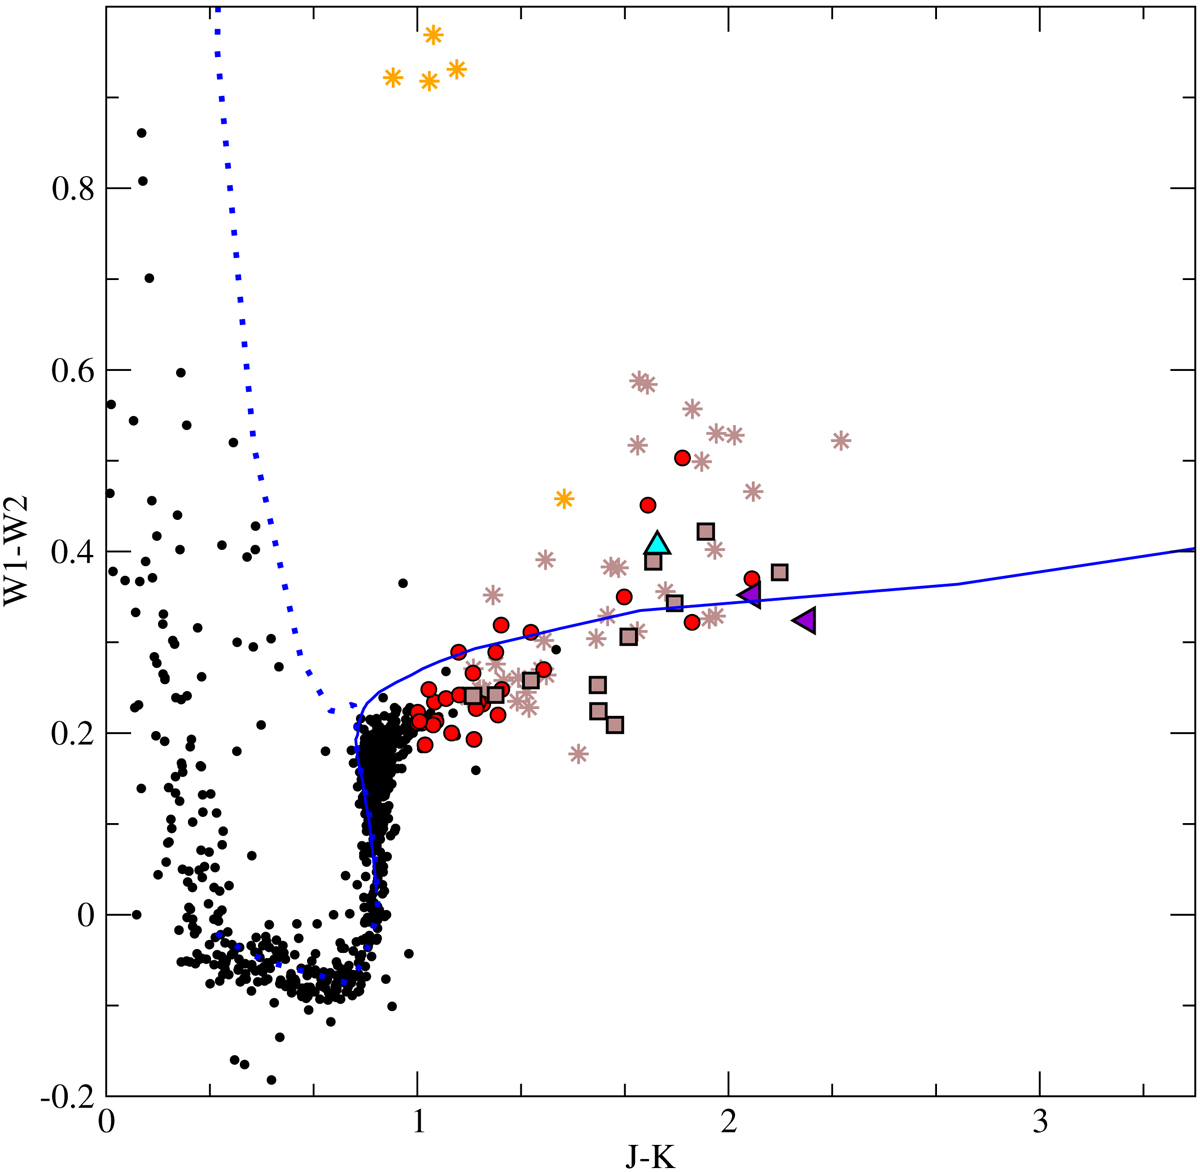
(J − K,W1 − W2) colour–colour diagram. Symbols are the same as in Fig. 4. Two isochrones for 600 Myr are also plotted: the solid line corresponds to the DUSTY model and the dotted line to the COND model. The yellow asterisk with the bluest W1−W2 colour corresponds to a T0 field dwarf.
Current usage metrics show cumulative count of Article Views (full-text article views including HTML views, PDF and ePub downloads, according to the available data) and Abstracts Views on Vision4Press platform.
Data correspond to usage on the plateform after 2015. The current usage metrics is available 48-96 hours after online publication and is updated daily on week days.
Initial download of the metrics may take a while.