Fig. 2.
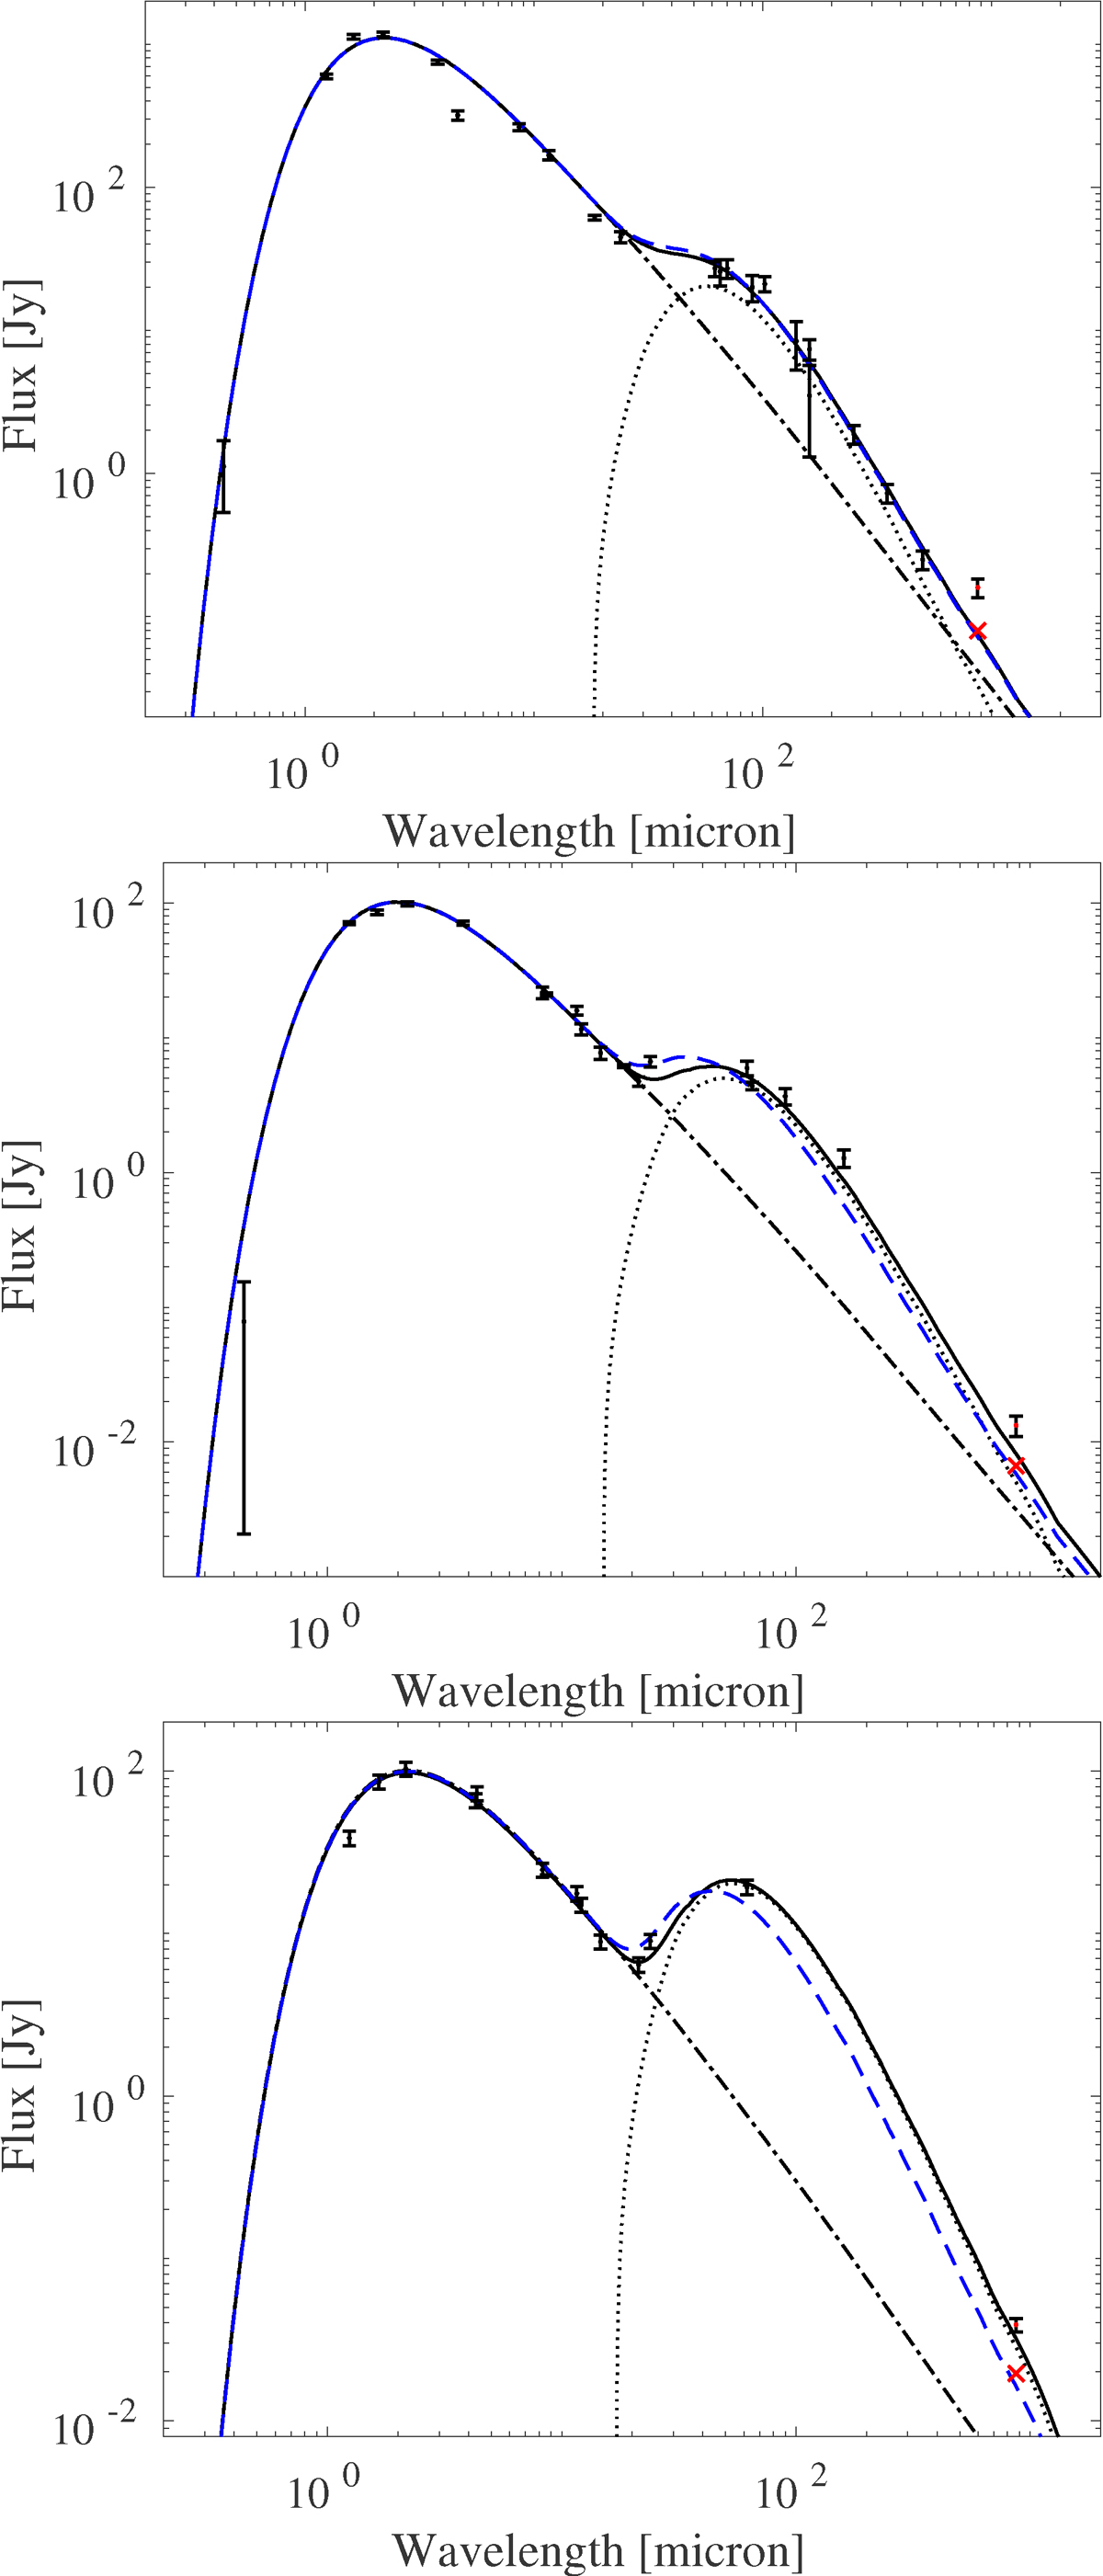
SEDs of U Ant (top panel), DR Ser (middle panel), and V644 Sco (bottom panel) with best-fit models for 0.1 μm sized grains (blue-dashed lines), and 1.0 μm (U Ant) and 2.0 μm (DR Ser and V644 Sco) sized grains (solid lines). The dot-dashed lines show the contribution to the total SED from the star and present-day wind, the dotted lines the contribution to the SED from the shells. The red crosses indicate the 50%-level of the LABOCA fluxes.
Current usage metrics show cumulative count of Article Views (full-text article views including HTML views, PDF and ePub downloads, according to the available data) and Abstracts Views on Vision4Press platform.
Data correspond to usage on the plateform after 2015. The current usage metrics is available 48-96 hours after online publication and is updated daily on week days.
Initial download of the metrics may take a while.