Free Access
Fig. 9.
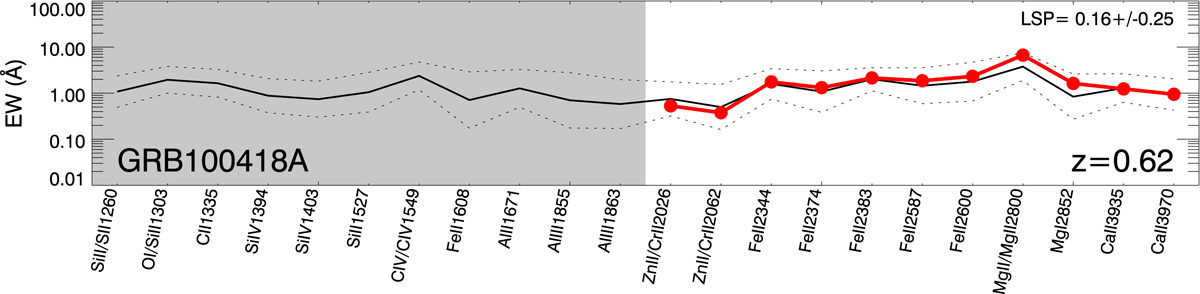
Line strength diagram of the afterglow of GRB 100418A, following the prescription of de Ugarte Postigo et al. (2012b). This figure compares the strength of the spectral features of GRB 100418A (in red) with the average values of a sample of 69 spectra (in black).
Current usage metrics show cumulative count of Article Views (full-text article views including HTML views, PDF and ePub downloads, according to the available data) and Abstracts Views on Vision4Press platform.
Data correspond to usage on the plateform after 2015. The current usage metrics is available 48-96 hours after online publication and is updated daily on week days.
Initial download of the metrics may take a while.