Fig. 6.
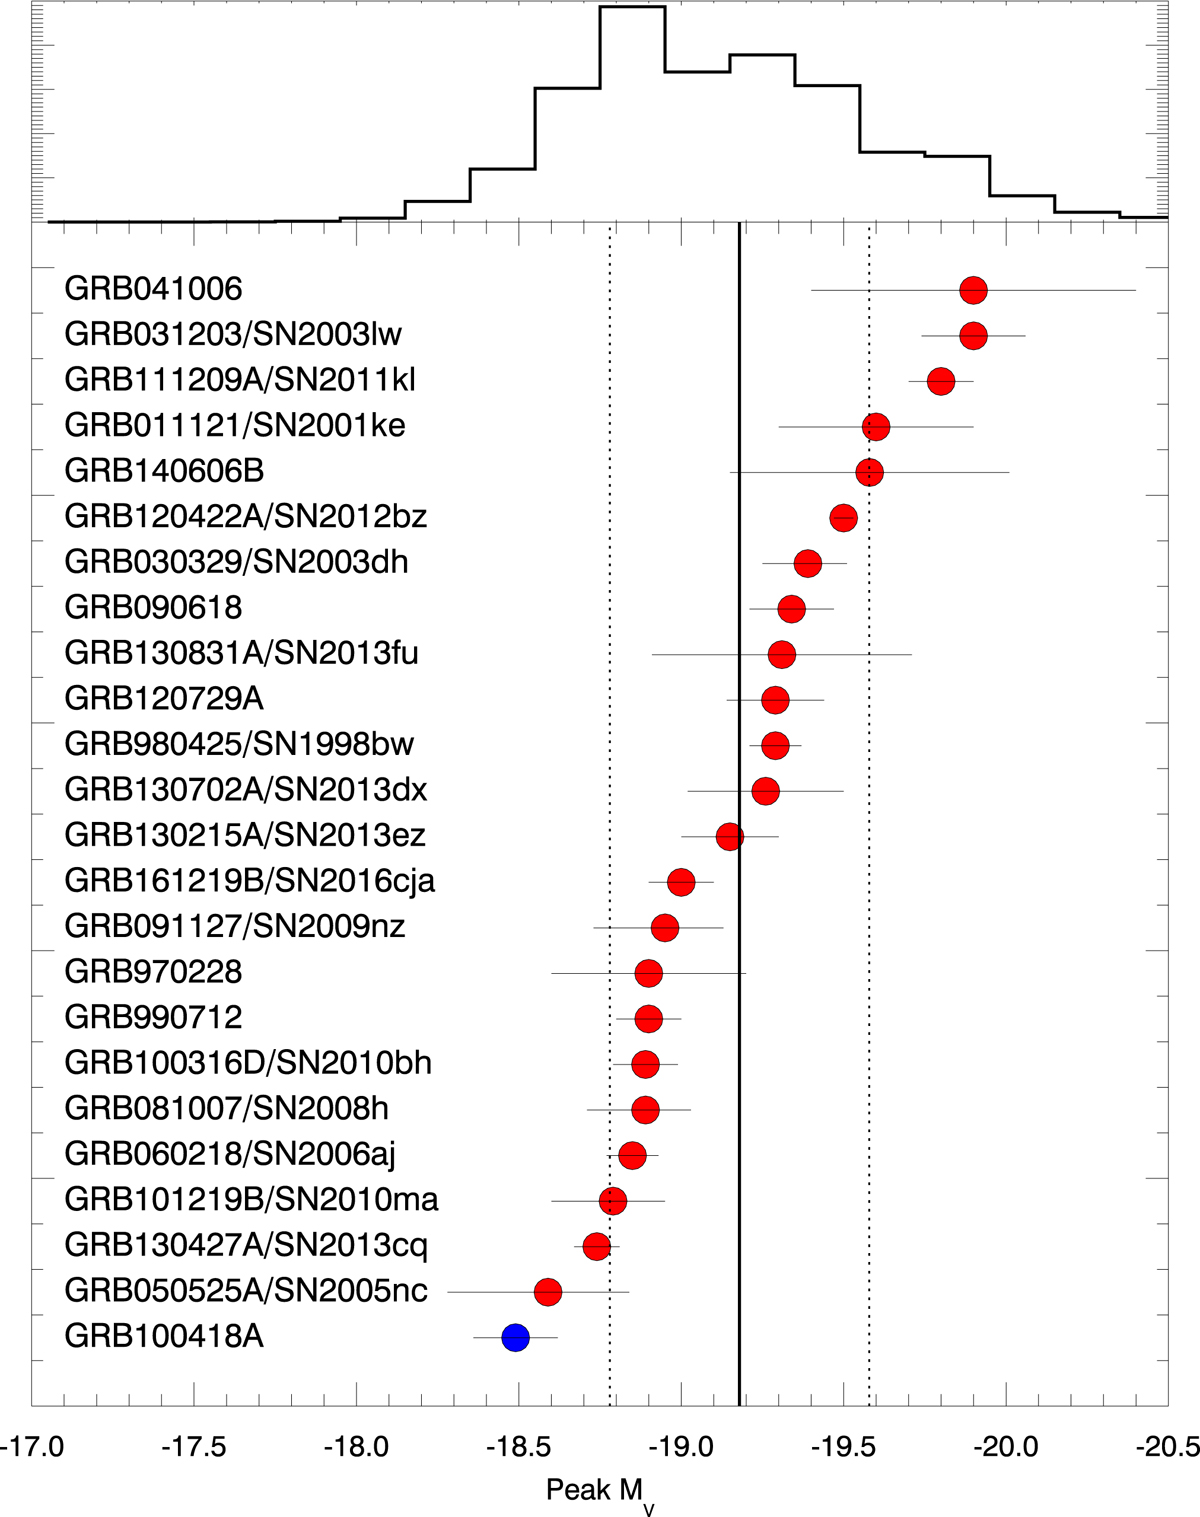
Peak absolute magnitudes in the rest frame V-band of a sample of GRB-SNe. The vertical solid line indicates the average of the sample, whereas the dotted lines indicate the standard deviation from this value. Top panel: histogram of the MV distribution. GRB 100418A, shown in blue, is the faintest supernova within this sample.
Current usage metrics show cumulative count of Article Views (full-text article views including HTML views, PDF and ePub downloads, according to the available data) and Abstracts Views on Vision4Press platform.
Data correspond to usage on the plateform after 2015. The current usage metrics is available 48-96 hours after online publication and is updated daily on week days.
Initial download of the metrics may take a while.