Fig. 5.
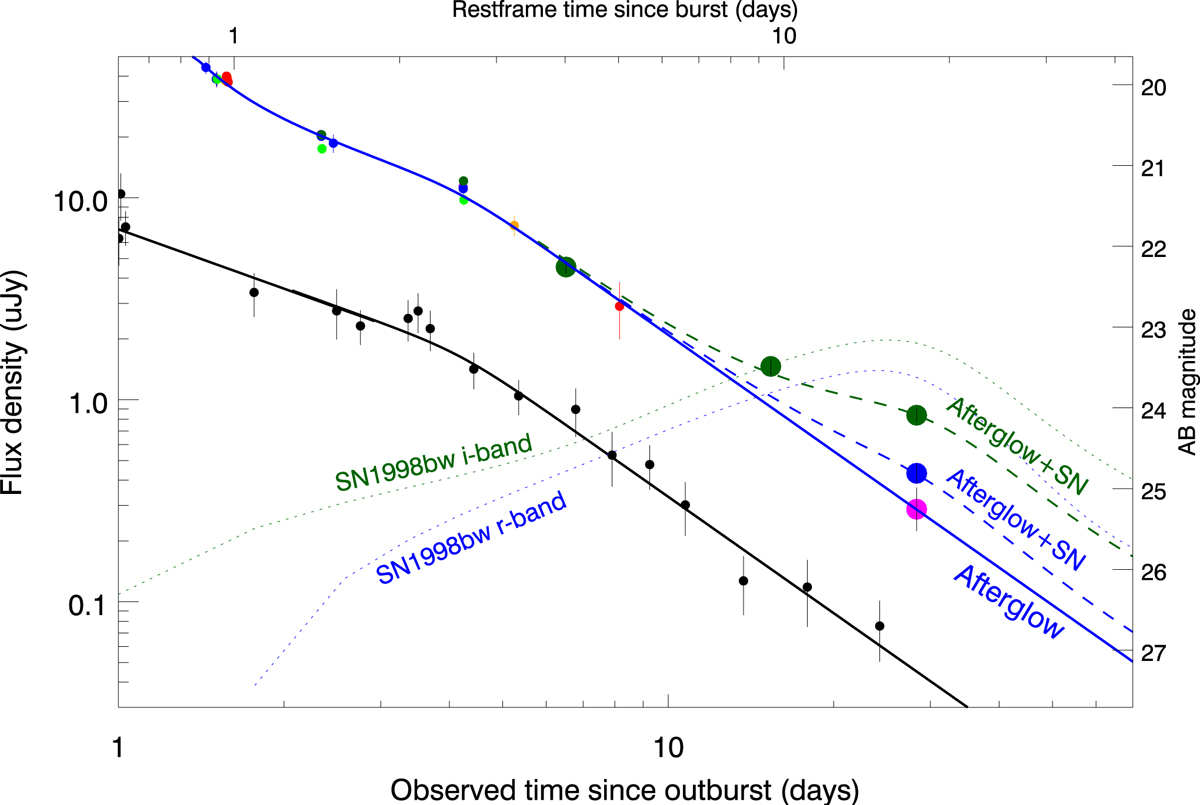
Late light curve of GRB 100418A in X-rays and optical, where the contribution of the host galaxy has been removed. All the optical bands have been offset to the r′-band for clarity. Only data with S/N above 3, after host subtraction are plotted. At late times image subtraction techniques (thick dots) show that there is an excess of emission in the r′ and i′ bands, corresponding to a faint supernova. Solid lines correspond to the afterglow contribution in X-rays and optical. The dashed lines show the combined contribution of afterglow and supernova (for which we used SN 1998bw templates) scaled to match the late photometry. The dotted lines show the expected light curves for SN 1998bw at the redshift of GRB 100418A. Colour coding is equivalent to that of Fig. 1.
Current usage metrics show cumulative count of Article Views (full-text article views including HTML views, PDF and ePub downloads, according to the available data) and Abstracts Views on Vision4Press platform.
Data correspond to usage on the plateform after 2015. The current usage metrics is available 48-96 hours after online publication and is updated daily on week days.
Initial download of the metrics may take a while.