Fig. 4.
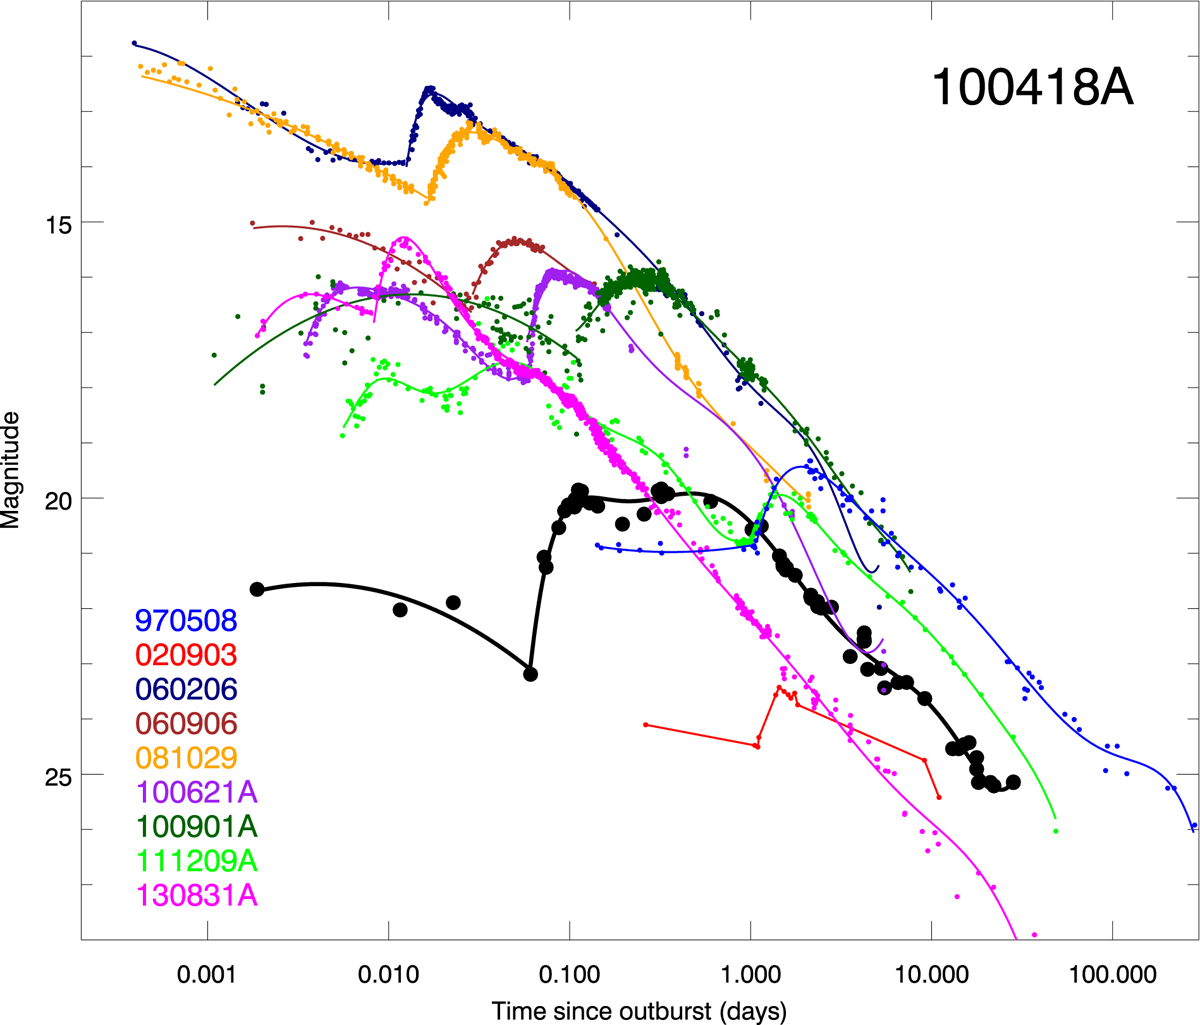
Comparison of the optical light curve of GRB 100418A (in black) with other GRB afterglows showing steep rebrightenings. All the light curves have been shifted to a redshift of z = 1 to allow for a direct comparison. When enough data are available the light curves have been fitted with two spline curves, one before the rebrightening and a second one after. When possible the contribution of the host galaxy has been subtracted.
Current usage metrics show cumulative count of Article Views (full-text article views including HTML views, PDF and ePub downloads, according to the available data) and Abstracts Views on Vision4Press platform.
Data correspond to usage on the plateform after 2015. The current usage metrics is available 48-96 hours after online publication and is updated daily on week days.
Initial download of the metrics may take a while.