Fig. 2.
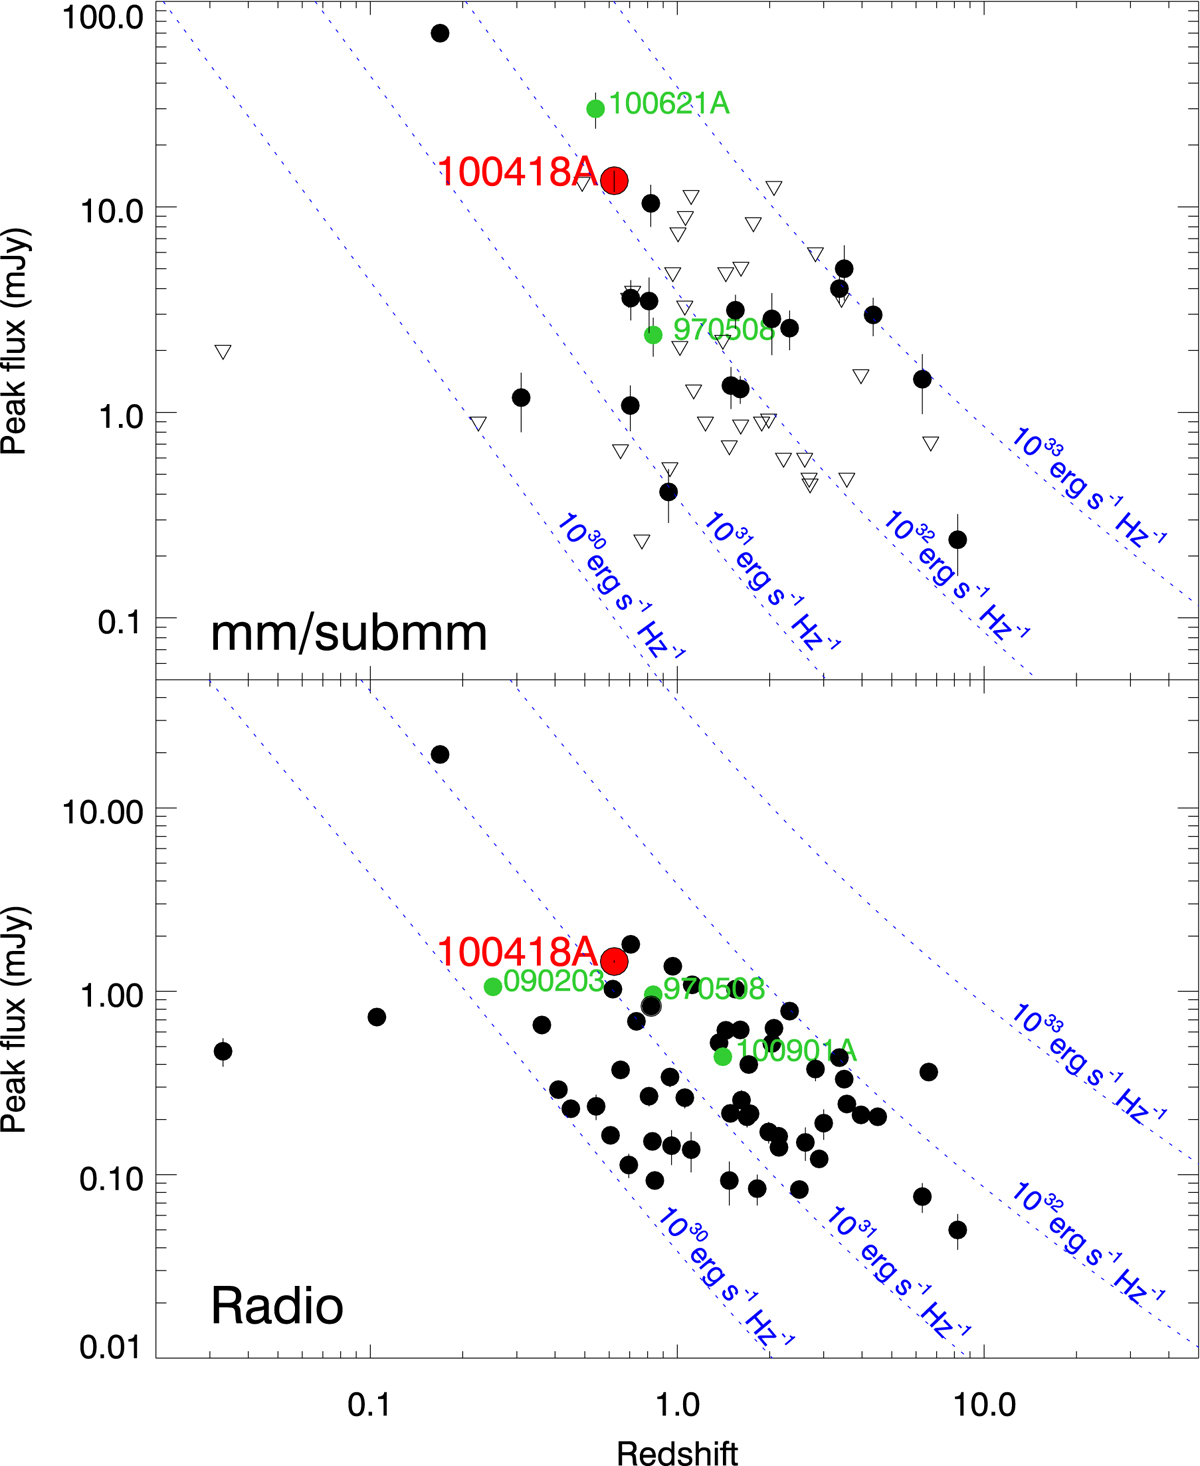
Peak flux densities of GRB 100418A as compared to the mm/submm and radio samples from de Ugarte Postigo et al. (2012a) and Chandra & Frail (2012). In blue we indicate lines of equal luminosity, with the most luminous events being found in the top right region of the plots. We have highlighted in green other GRBs where strong rebrightenings have been observed (see Sect. 3.3).
Current usage metrics show cumulative count of Article Views (full-text article views including HTML views, PDF and ePub downloads, according to the available data) and Abstracts Views on Vision4Press platform.
Data correspond to usage on the plateform after 2015. The current usage metrics is available 48-96 hours after online publication and is updated daily on week days.
Initial download of the metrics may take a while.