Fig. 14.
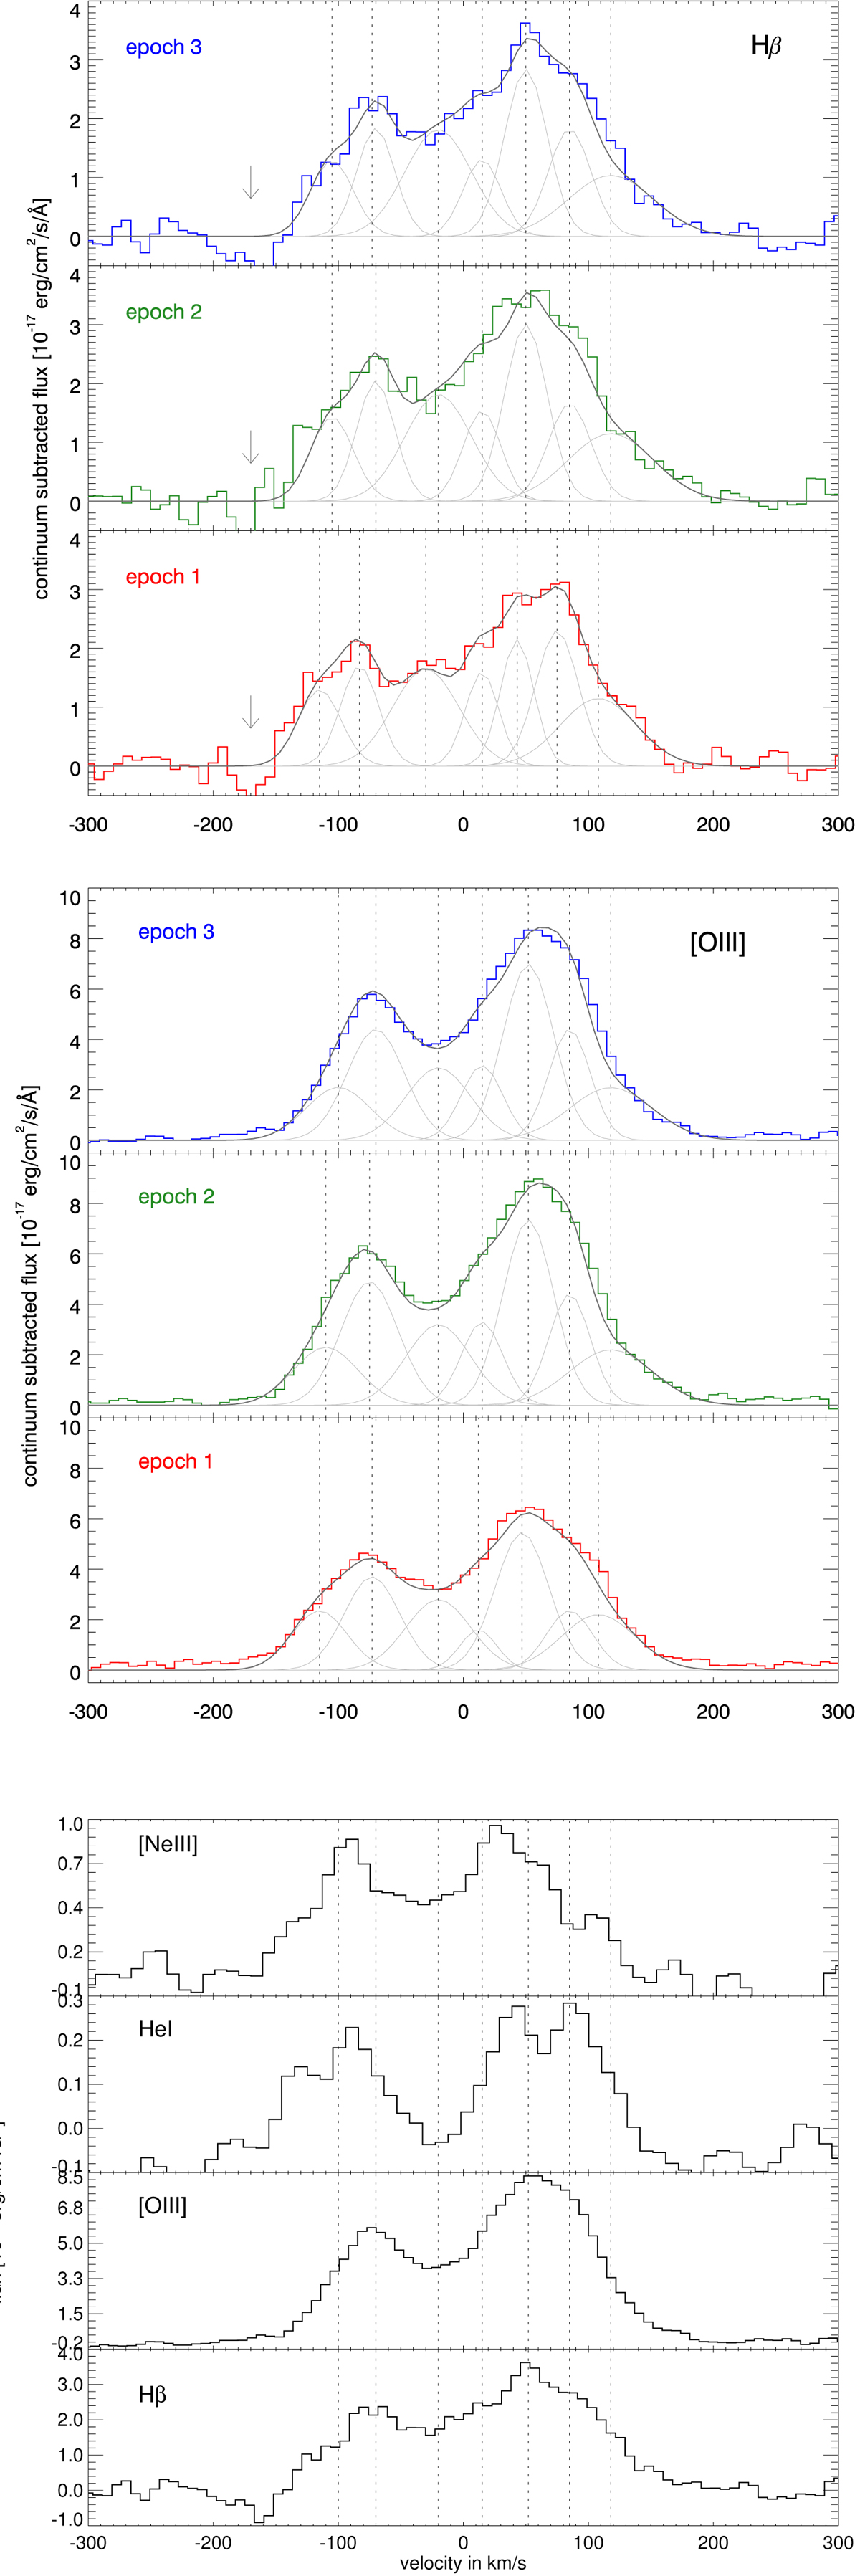
Gaussian fits to the Hβ (top panel) and [O III] (middle panel) emission lines at the three epochs of X-shooter spectra analysed here. The arrows in the plot of Hβ indicate a possible stellar absorption component that we do not fit since the flux goes to negative values. The bottom panel shows [Ne III] and [He I] emission lines from the third epoch compared to Hβ/[O III] and the main (narrow) components fitted in Hβ indicated for comparison.
Current usage metrics show cumulative count of Article Views (full-text article views including HTML views, PDF and ePub downloads, according to the available data) and Abstracts Views on Vision4Press platform.
Data correspond to usage on the plateform after 2015. The current usage metrics is available 48-96 hours after online publication and is updated daily on week days.
Initial download of the metrics may take a while.