Fig. 12.
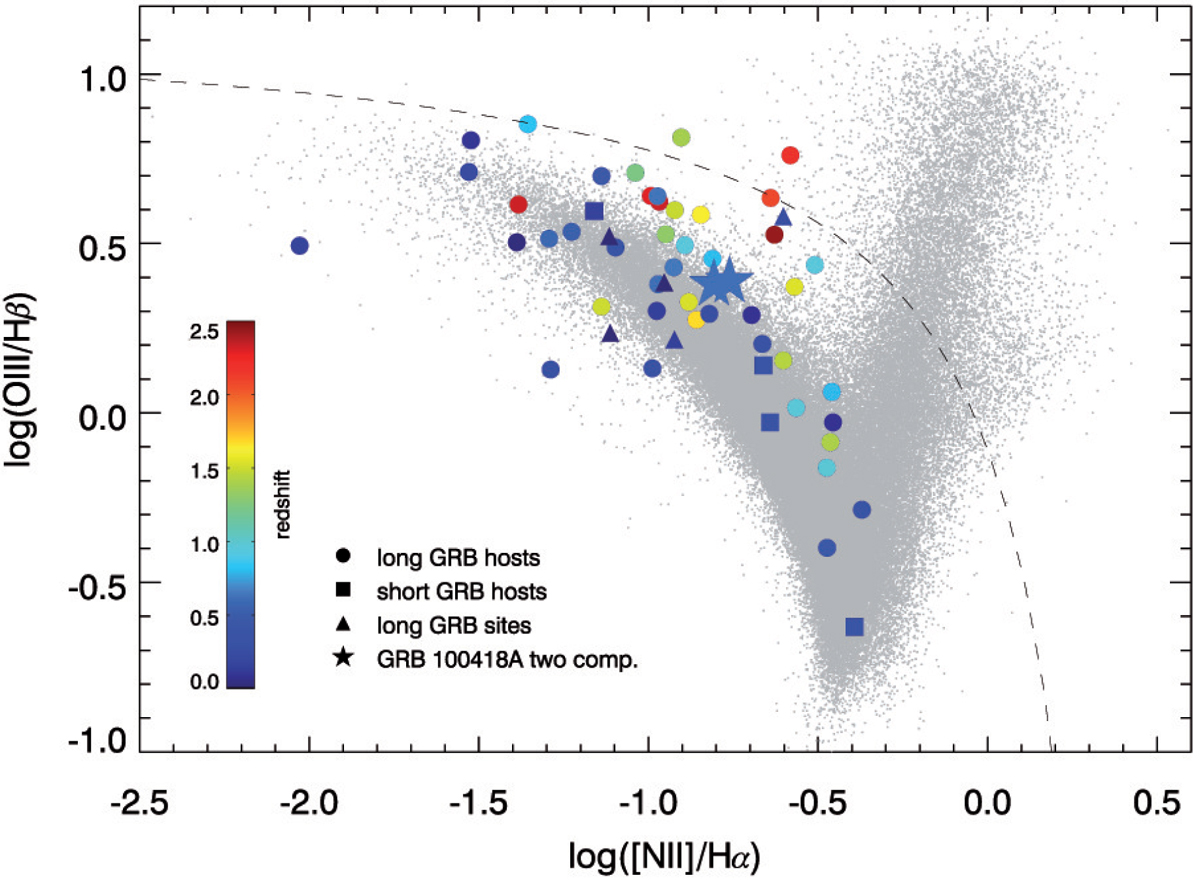
BPT diagram for long and short GRB hosts and GRB sites from the literature compared to SDSS galaxies (grey dots) and the two SF regions in the host of GRB 100418A (stars). The redshift of the hosts is colour-coded in the plotted symbols. Emission line fluxes used are taken from Christensen et al. (2008), Berger (2009), Han et al. (2010), Levesque et al. (2010), Perley et al. (2012), Schulze et al. (2014), Thöne et al. (2014), Krühler et al. (2015), Stanway et al. (2015), Vergani et al. (2017), Izzo et al. (2017).
Current usage metrics show cumulative count of Article Views (full-text article views including HTML views, PDF and ePub downloads, according to the available data) and Abstracts Views on Vision4Press platform.
Data correspond to usage on the plateform after 2015. The current usage metrics is available 48-96 hours after online publication and is updated daily on week days.
Initial download of the metrics may take a while.