Fig. 11.
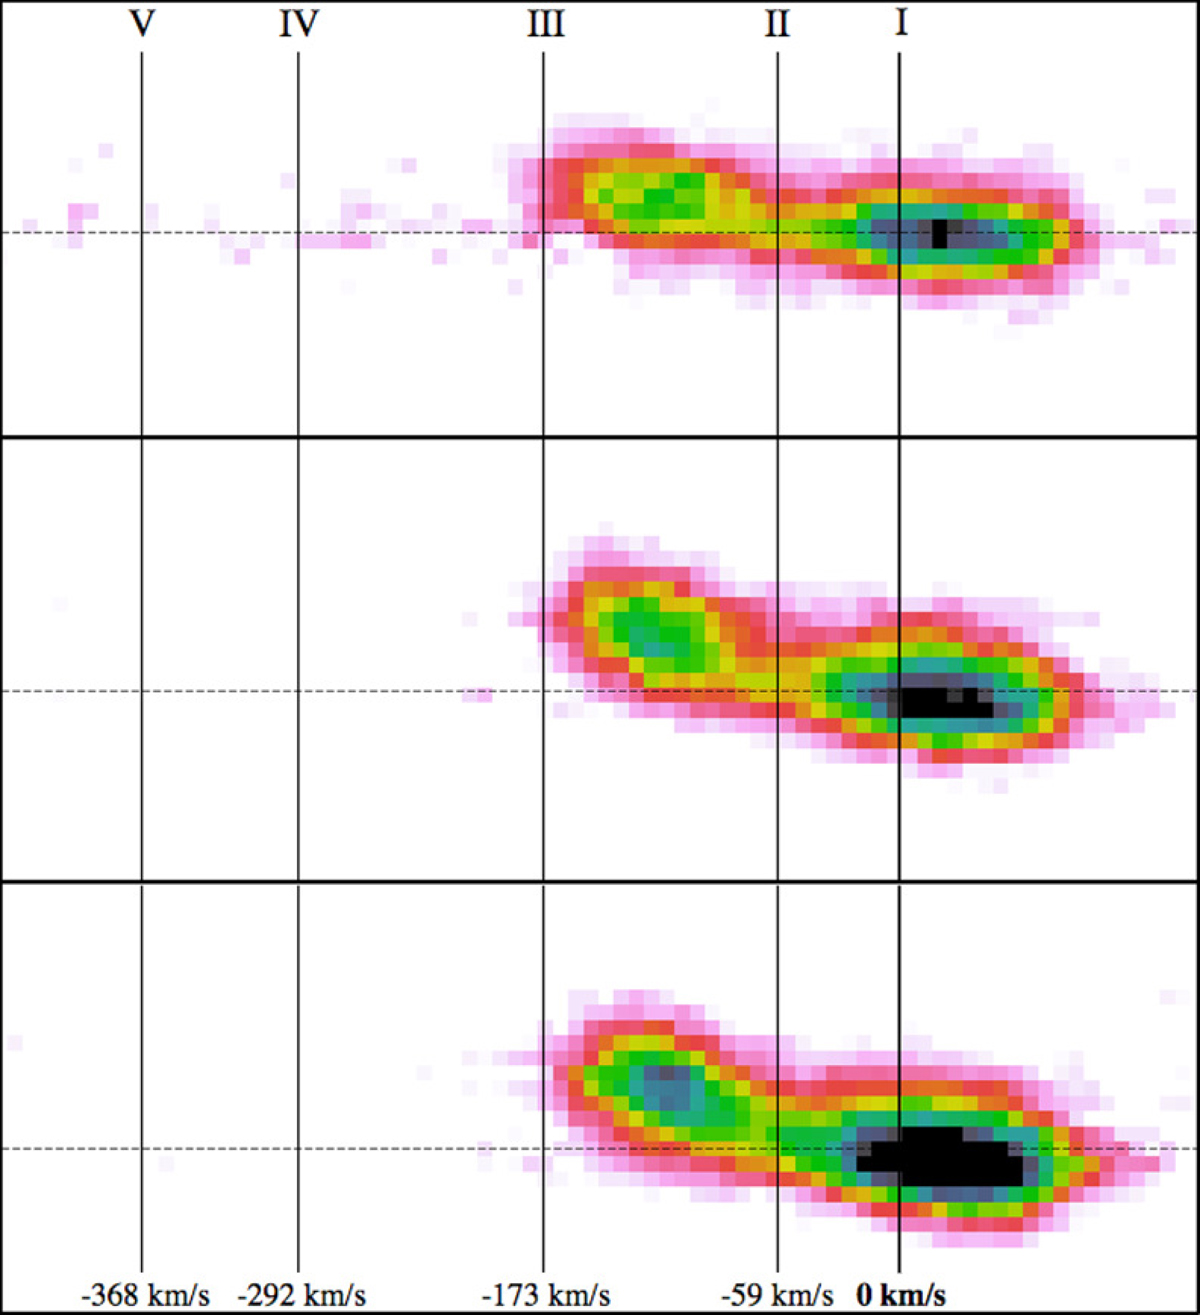
Section of the 2D spectra showing the [O III]λ5008.24 emission line, with continuum subtracted, for each of the three spectral epochs (from top to bottom panels). The spatial axis is vertical, while the spectral dispersion is horizontal. The northernmost part of the slit is to the top (see Fig. 7 for each slit orientation). The dashed line marks the position of the GRB afterglow in the spatial direction. Horizontal lines indicate the relative velocities of the 5 main absorption components, some of which are related to the emission features.
Current usage metrics show cumulative count of Article Views (full-text article views including HTML views, PDF and ePub downloads, according to the available data) and Abstracts Views on Vision4Press platform.
Data correspond to usage on the plateform after 2015. The current usage metrics is available 48-96 hours after online publication and is updated daily on week days.
Initial download of the metrics may take a while.