Fig. 2.
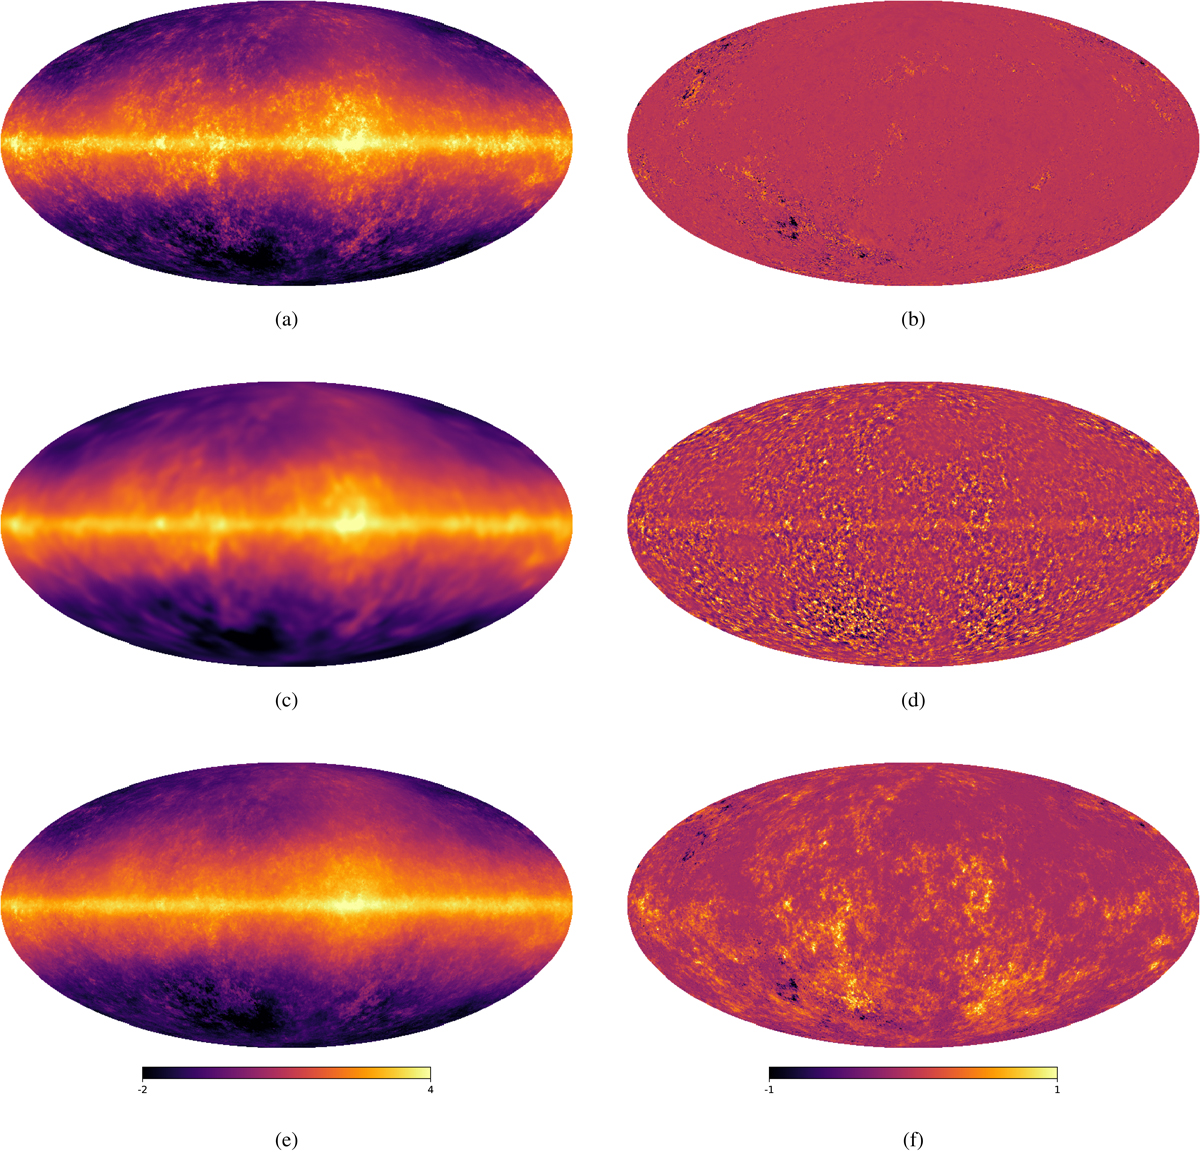
Reconstruction and resolution improvement of Mock I. Note the different color bars for the maps on the left and right, respectively. The GMM is trained with K = 9 Gaussians, and the predictions are determined from the CPD marginalized over the respective Mock I data set. Panel a: prediction of Mock I. Panel b: difference between the original Mock I map and the prediction, rms = 0.05. Panel c: smoothed map of Mock I. Panel d: difference between the original Mock I map and the smoothed one, rms = 0.23. Panel e: prediction of the smoothed Mock I map. Panel f: difference between the original Mock I map and the prediction based on the smoothed one, rms = 0.17.
Current usage metrics show cumulative count of Article Views (full-text article views including HTML views, PDF and ePub downloads, according to the available data) and Abstracts Views on Vision4Press platform.
Data correspond to usage on the plateform after 2015. The current usage metrics is available 48-96 hours after online publication and is updated daily on week days.
Initial download of the metrics may take a while.