Fig. 3.
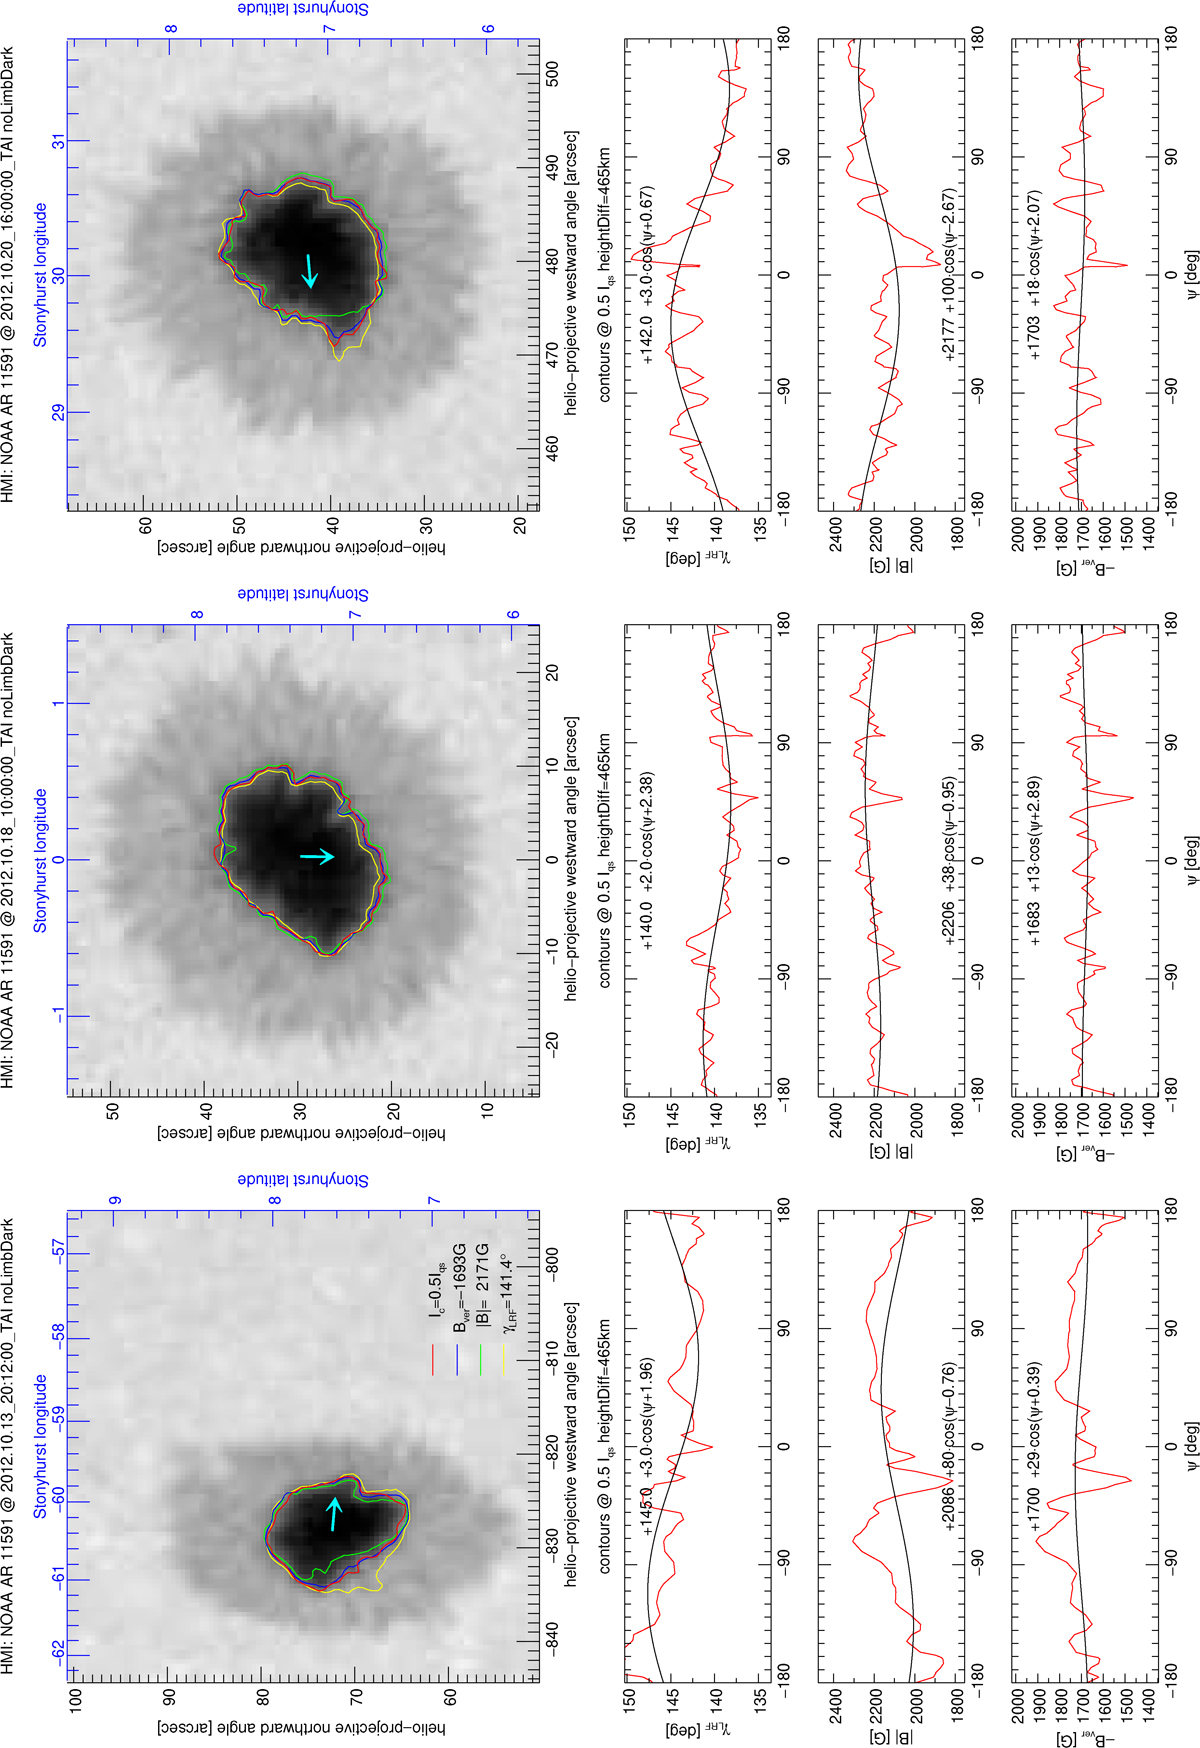
NOAA AR 11591, top panels: continuum intensity maps for longitudes −60°, 0° and 30°. The legend in the lower right corner of the top left panel defines the contour levels. Different formation heights are accounted for (Eq. (1), Δh = 465 km). The cyan arrow originates in the centroid of the umbra and points towards disc centre. Bottom three rows: magnetic field parameters retrieved along the Ic = 0.5Iqs contour. The temporal evolution is available online.
Current usage metrics show cumulative count of Article Views (full-text article views including HTML views, PDF and ePub downloads, according to the available data) and Abstracts Views on Vision4Press platform.
Data correspond to usage on the plateform after 2015. The current usage metrics is available 48-96 hours after online publication and is updated daily on week days.
Initial download of the metrics may take a while.