Fig. 7
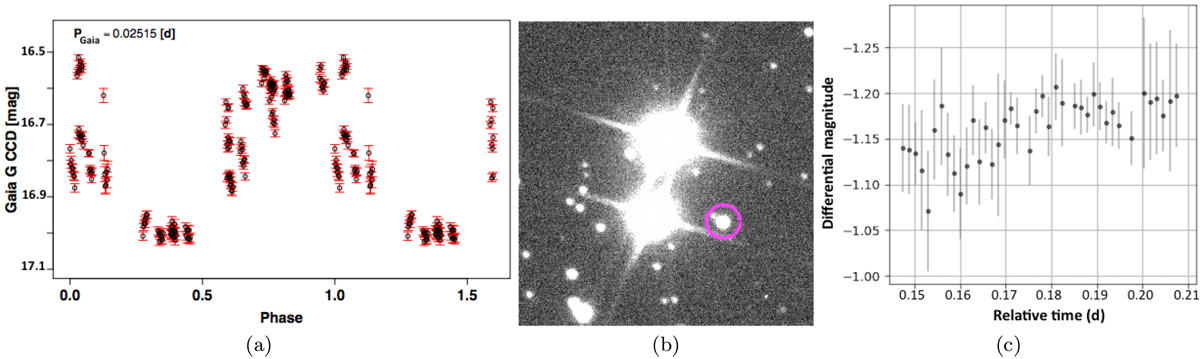
Example of preliminary candidates for short-timescale and suspected periodic variability whose G light curve iscontaminated by two nearby bright stars. Panel a: Gaia G per-CCD phase-folded light curve. Panel b: excerpt of animage in the R band from the MAIA photometer (Raskin et al. 2013); the targeted candidate is encircled in magenta. Panel c: MAIA differential photometry light-curve in R band obtained with ePipe.
Current usage metrics show cumulative count of Article Views (full-text article views including HTML views, PDF and ePub downloads, according to the available data) and Abstracts Views on Vision4Press platform.
Data correspond to usage on the plateform after 2015. The current usage metrics is available 48-96 hours after online publication and is updated daily on week days.
Initial download of the metrics may take a while.